Simulating and properly analyzing complex thermo-fluid systems is a difficult endeavor. The complexity stems from the critical need to fully capture the flow characteristics within the system, model components with enough detail to describe their physics and operation accurately, and analyze the sometimes non-obvious interactions that occur between all parts making up the system.
With the latest software release, 2511, additional features, physics and components have been added to improve simulation accuracy, decrease the time spent on manual tasks, and ultimately assist you in your decision-making process.
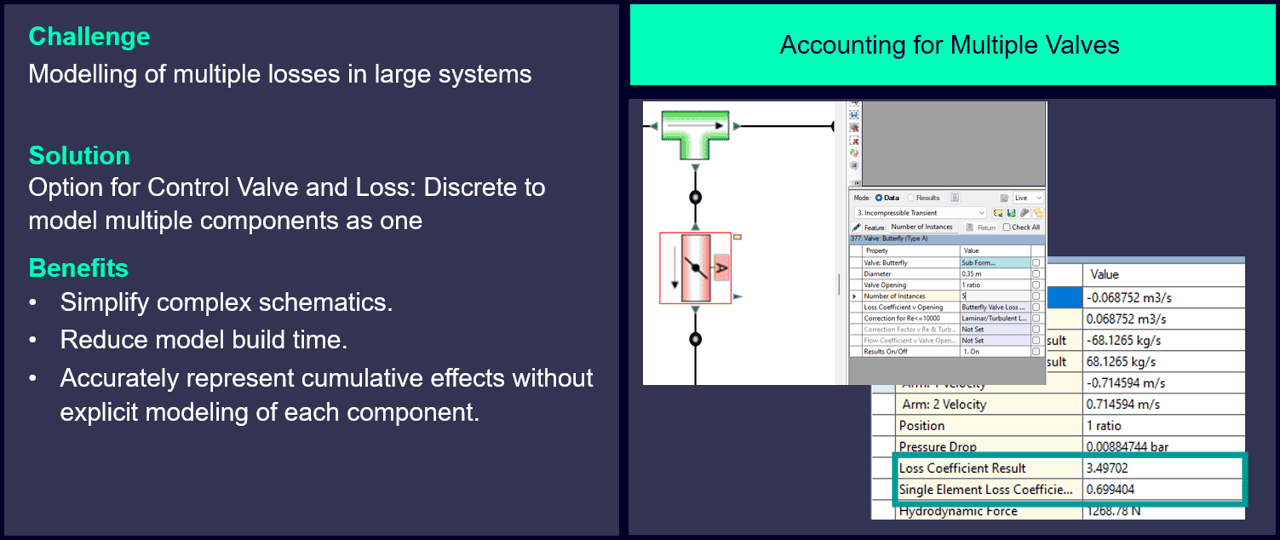
In version 2511 a new controller type is introduced. The new Hybrid Junction Controller can handle multiple inputs with different gain factors allowing you to consolidate what previously required several components into a single, purpose-built element. Non-Newtonian fluids, fluids with variable viscosity changing with the shear rate, can now be modelled as temperature dependent in 2511. As the fluid is heated or cooled during a simulation the non-Newtonian characteristics are adjusted accordingly. For very large models, containing perhaps several hundred pipes, it was previously somewhat cumbersome to effectively update pipe diameters according to schedule. With the new filter option under Pipe Scheduling, mistakes can be avoided by finding the specific pipes you want to modify directly from your current collection. Exporting results to .csv is now possible using a single bulk export operation. This feature allows for the selection of multiple components and their numerus result types into a single table and export.
In this post we will go over and showcase some of the recent additions in more detail:
- Enhanced Visualization for Fluid Mixing
- Flow Tracking
- Fluid Mixing in 3-Arm Reservoirs
- Bulk Loss Option for Valves and Discrete Loss
The new release introduces an enhanced System Results display that simplifies the analysis of multi-fluid proportions in complex systems by visualizing the concentrations directly in your system view. Previously, users had to review numerical data tables to understand the mixing behaver of fluids like coolant, water, and seawater coming from different sources. The new visualization uses color coding and percentage displays to clearly show the mixture composition at various points throughout the system making your results more understandable.

This enhanced visualization offers significant practical advantages for the analysis workflow. Visual representation allows users to more quickly understand the mixing process and ensure that mixing occurs as intended. The visual format also simplifies the identification of potential issues; unexpected concentrations at any point become more obvious. This is particularly useful for thermal management systems, distribution systems, chemical processing, or any application where maintaining specific mixture ratios is important for system performance. The graphical display simplifies the process of sharing and explaining results within your organization.
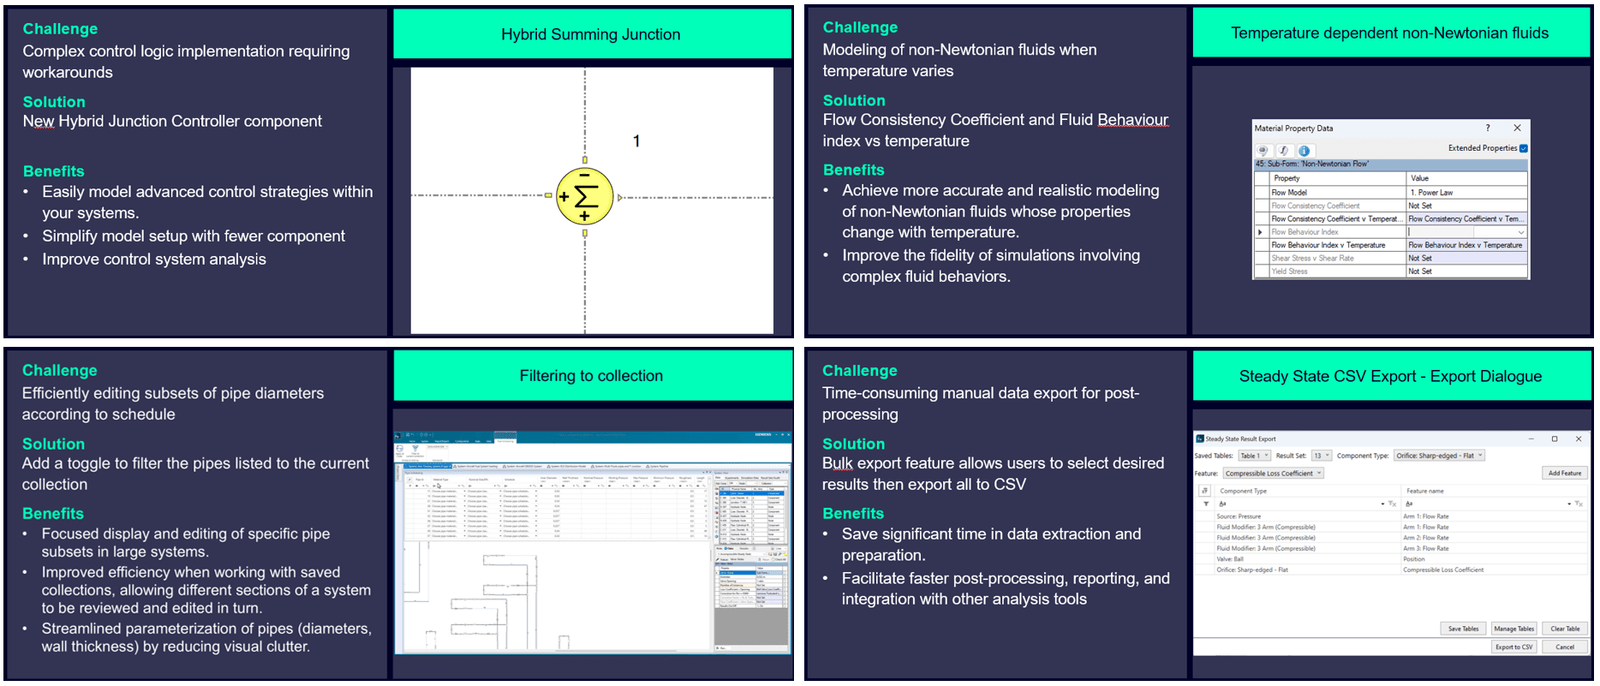
Similar to how concentrations are displayed, a new method for visualizing flow origins and contributions has been added. In systems with multiple inlets and outlets, it was previously difficult to answer questions such as: When you observe flow at a particular outlet, which inlet sources are contributing, and in what proportions? This information is important for troubleshooting unexpected behavior, optimizing system design, or ensuring proper distribution of different fluid sources. Previously, answering this question required extensive post-processing or running multiple scenarios with different inlet configurations. The manual effort involved made this type of analysis time-consuming and often impractical.
With the Flow Tracking feature in 2511, you can now visually identify which inlet sources contribute to the flow at any given outlet. As shown in the figure above, the feature uses color coding to indicate contributions from each source, providing immediate insight into system flow patterns, without any manual calculations or post-processing. This makes troubleshooting faster, allowing you to quickly determine whether flow is coming from an unexpected source. It also enables you to optimize your system by evaluating how changes impact the contributions from different sources, ensuring the desired flow distribution is achieved.
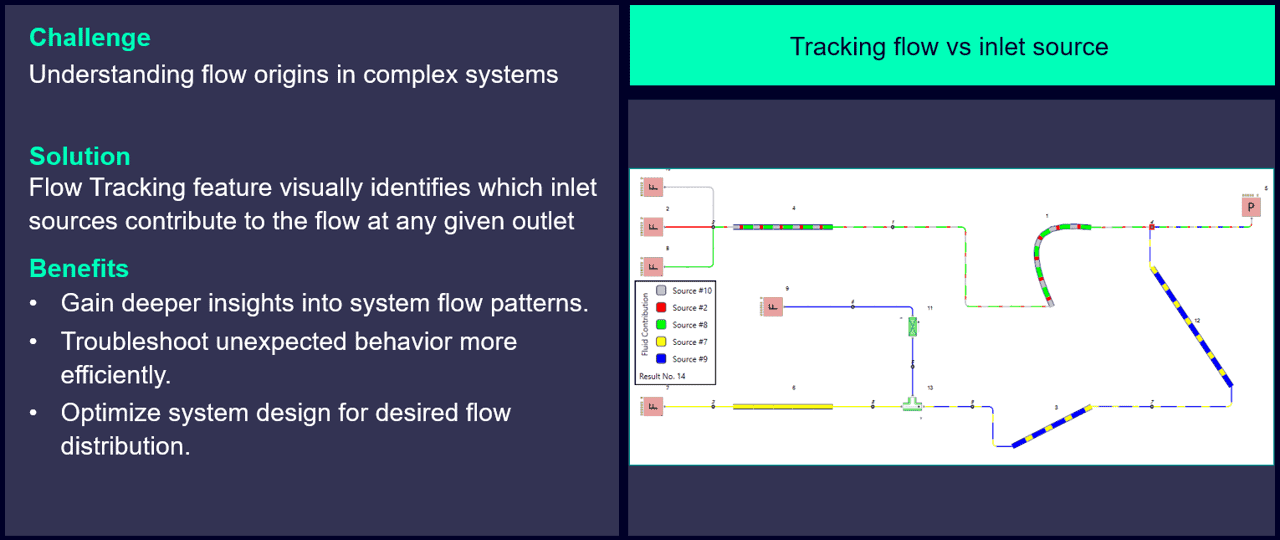
Modeling fluid mixing in reservoirs during transient simulations has been a limitation. When you have multiple fluids entering a reservoir from different arms, understanding how those fluids mix over time is important for many applications. Previously, the 3-arm reservoir component had limited capability to track and model this mixing behavior during transient conditions. This made it difficult to analyze systems where fluid composition changes over time.
New in 2511 is that the 3-arm Reservoirs have been enhanced to improve modeling of fluid mixtures during transient operation. As shown above, you can now define liquid concentration data for different fluid types entering each arm. The component tracks how these concentrations evolve over time as fluids mix within the volume. With this you gain understanding of how your mixing process evolves during startups and shutdowns, information that was previously difficult to obtain. The setup is done through the liquid concentration data interface.
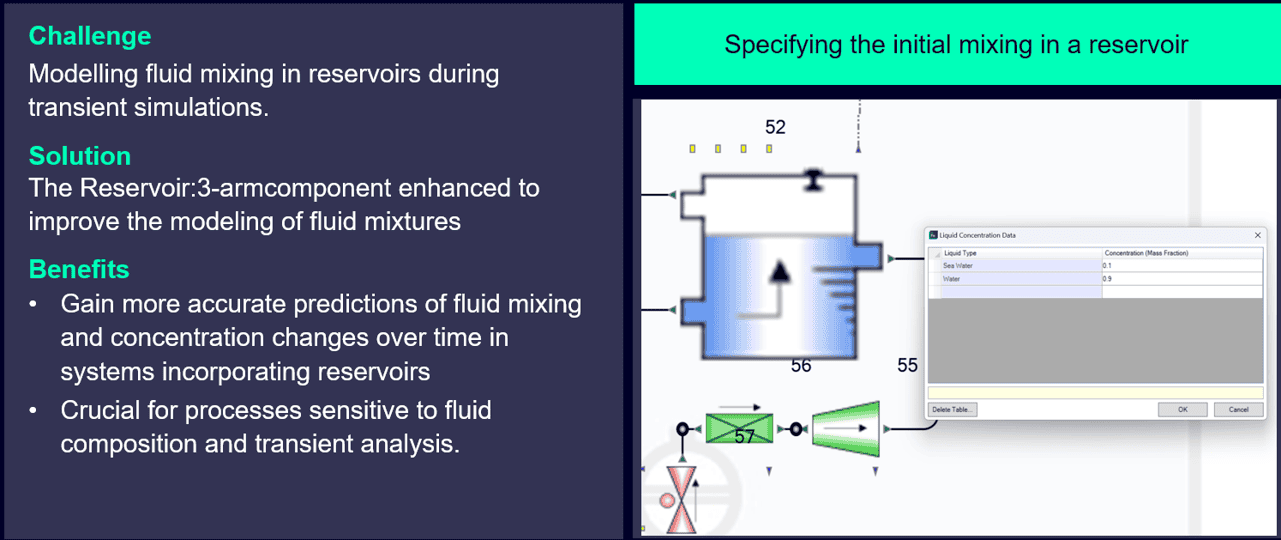
In large industrial systems it is common to have multiple identical or similar components in series, such as valves, filters, or fittings along a pipeline. Before 2511, accurately modelling cumulative pressure loss required adding each component individually to your system. For example, a system with ten butterfly valves in series meant placing ten separate valve components. This not only made the model overcrowded with components but also increased the model creation time and made large models more difficult to navigate and view.
A solution to this comes with the new bulk loss option for Control Valve and Loss: Discrete components. As outlined in the image above, you can now specify the number of identical valves through the “Number of Instances” parameter. The component automatically accounts for multiple identical elements without requiring individual placement. In the results table, the Loss Coefficient Result reflects the cumulative effect of all instances while still showing the Single Element Loss Coefficient for reference. You simply enter the number of instances, and the component handles the rest.
This feature brings several practical workflow improvements. Simplified models, reduced model creation time, and low likelihood for mistakes being some of them.
Apart from the new features updates of 2511, two new Sample System models have been created and are now available:
Data Center Cooling Simcenter STAR-CCM+ FMU
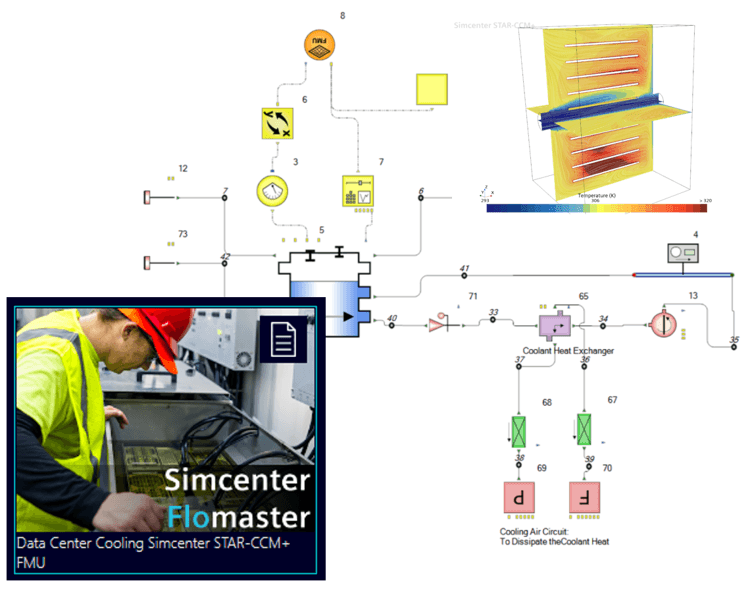
This Sample System demonstrates using Simcenter Flomaster to model an Immersed Data Center and Heat Exchanger, as well as using Simcenter STAR-CCM+ to create an embedded FMU to model the Data Center in a 3D domain to be used in a separate 1D system case.
Rotating Cavity Secondary Air
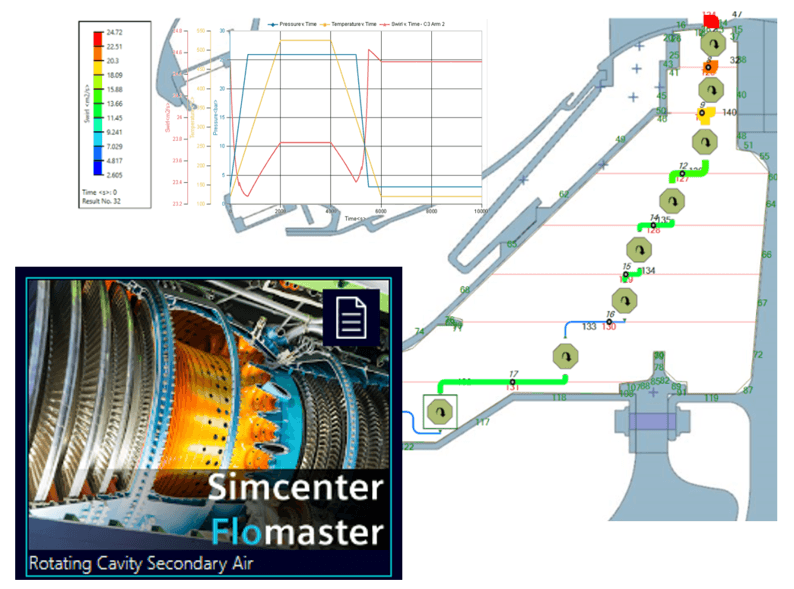
This Sample System demonstrates an in-depth Secondary Air System (SAS) design, given a set of defined boundary conditions and general geometry using rotating cavity components
We hope you have found this article interesting. If you have any questions or comments, please feel free to reach out to us at support@volupe.com.
Author
Fabian Hasselby, M.sc.