Improving the productivity for Hull performance simulation is a major concern for the developers of Simcenter STAR-CCM+. The dedication of Simcenter STAR-CCM+´s developers to Marine Application and hydrodynamic simulation of ships has been addressed in a previous blog article and a webinar. In this week’s blog article, we take a closer look on the Virtual Tow Tank (VTT) template, developed, and provided by Siemens. We will compare resistance performance simulation for the Kriso Container Ship (KCS), both of the Hull Performance Workflow (HPW) and the VTT template and try to help you decide which tool to use.

Virtual Tow Tank Template
The template approach is the contemporary solution of specialized tools to enhance productivity. A template, and so the VTT, is a completely open methodology that leverages all new functionalities in Simcenter STAR-CCM+ and allows you at the same time to adapt it to your needs.
The VTT serves as a baseline simulation file and requires a user to simply import their CAD in the correct convention before specifying the required draft, velocity, and fluid properties. The simulation operation workflow can then be executed to mesh and run the simulation file, as all required fields are pre-populated with dynamic queries and filters.
Similar to the Hull Performance Workflow application productivity tool (HPW), are all mesh refinements, fluid properties etc. dynamically pre-defined according to generally accepted Best Practice for calm water resistance simulation. This reduces errors and reduces the amount of time you´re taking for setting up and running repeated design.
Multi Mesh Sequence
Yet, the VTT offers even more to you. The build in logic, from Simulation Operation functionality, allows for the Multi-Mesh-Sequencing. With this method we can reduce the computational time to reach a converged quasi-steady solution by solving on a number of course meshes sequentially. Once convergence is achieved at each level, the domain re-meshed according to the grid resolution of the next level.
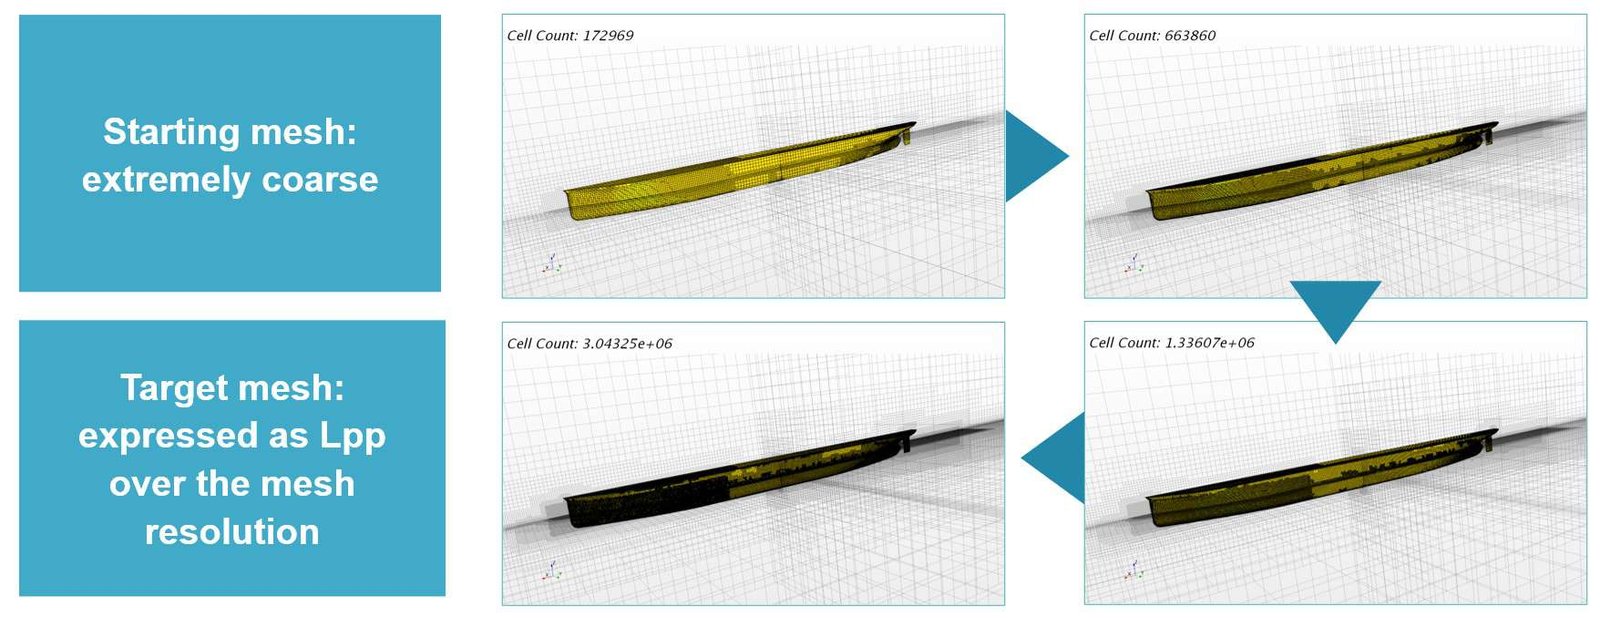
Benefits of this approach are that the motion can be converged prior to reaching the final grid resolution, numerical noise after initialisation is convected though the domain in less computational time, and as the vessel position is updated between each level, the grid remains aligned with the free surface.
On a simulation of the resistance curve a of four velocities, Siemens achieved a speed-up of 2.5 times faster using the MMS approach over the standard simulation entirely on a final desired grid resolution. The accuracy of the Lloyd´s Register benchmark vessel M/V Regal (also used in an ongoing research project Jores), was not affected by the MMS method.
Resistance curve prediction
Using the HPW will produce a java script that you can run in batch with the simulation file to perform an analysis of all previously defined velocity range. Java scripting is a powerful tool for automation of Simcenter STAR-CCM+, but also have drawbacks, e.g. additional files to ship, sensitive for updates, etc.
Performing a speed prediction with the VTT is possible with the STAR-CCM+´s Design Manager. Simply create a Design Manager Project from your simulation and create a new Manual Design Study. Here are free to define the velocities which shall be run automatically later.
There is no need to run the reference simulation priori the automatic speed curve prediction. The mesh will be created for each speed. The boundary layer representation will therefore be optimized for each speed.
Tip:
When setting up the reference simulation file there are two important steps to consider!

- Make sure that the mesh pipeline is not outdated.
The Design Manager runs the pipeline. This means if the mesh operations are out of date, Simcenter STAR-CCM+ will first create a new mesh before running simulation operation. In our this is wasted resources since the mesh command will be called from the simulation operation based on the changed prismlayer setup.
- Ensure that the Simualtion Operation is reset in the reference simulation. Such that all operations are called and the mesh is perfectly adapted to the new speed.

Test case KCS Container ship
So, how accurate and fast is the VTT compared with the HPW performance? Can we reproduce the same results Siemens obtained with the benchmark case, but on a different ship?
Here we use the, also well-know benchmark Kriso Container Ship (KCS) and perform full-scale simulation, both with the help of HPW and the VTT template. The CAD geometry and test data are available for instance from Tokyo 2015 CFD Workshop in Ship Hydrodynamics (https://t2015.nmri.go.jp). But CFD results for this ship are also discussed in various publication.
- Alejandro M. et. al, ‘Full scale self-propulsion computations using discretized propeller for the KRISO container ship KCCS’, preformed however, simulations on the full-scale ship. For propulsion coefficients the towed, unpropelled case are also computed.
Together, these computations provide for a complete CFD prediction of self-propulsion factors at full scale. The main differences with a similar model scale simulation following the ITTC procedures are identified and reported.
- Feng, et. al ‘Numerical Simulation of the Ship Resistance of KCS in Different Water Depths for Model-Scale and Full-Scale’, obtained the same results for the bare-hull resistance coefficient in a Verification and Validation study on both model scale and full-scale.
Using the tools for Hull Performance simulation, provided by Siemens, allows for a very short lead time. To compile this blog article, I needed about 2 days. Whereupon research and writing consumed almost half of the time. Setting up in the reference cases until they were up and running, was a matter of 30 minutes.
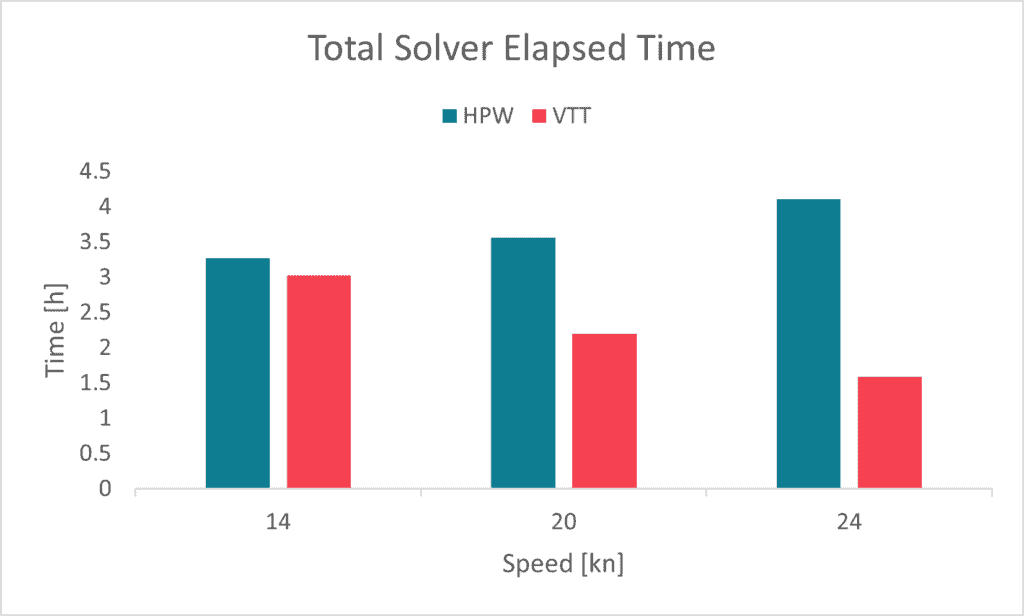
The simulations were carried out overnight thanks to the automation capabilities. But in total-hours, outperformed the VTT with the MMS approach the HPW with a speed up of 1.6! This is not as much as what Siemens obtained on the M/V Regal case which runs at half the ship speed. However, noticing this is achieved without any modification the standard tools settings and very little engineering time, I think this is outstanding!
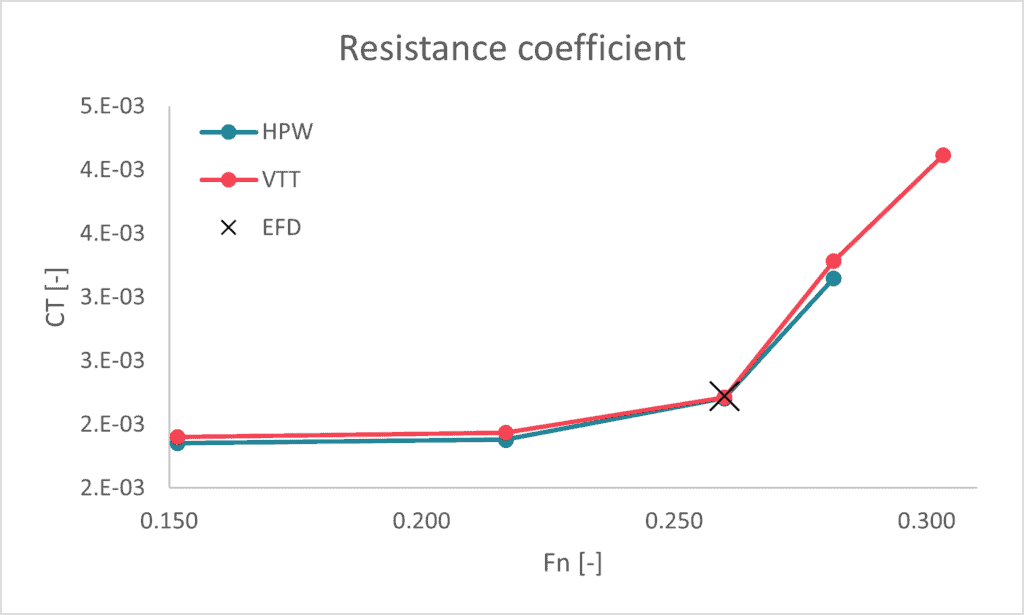
In terms of accuracy can we notice that both tools provide good results compared with other publications that refer to extrapolated EFD (experimental fluid dynamics) performance. The VTT under predicts the resistance at Fn = 0.26 with only 0.3% and HPW under predicts resistance with 0.7%.
In summary!
Both tools are quite capable for Hull Performance Simulation. The VTT template is more flexible and customizable. It is also advantageous for a resistance curve study due to velocity adapted boundary layer definition and the Multi-Mesh-Sequencing to reduce lead time. On the other hand is the HPW, a specialised tool for carrying out resistance, sink and trim analyses which is designed to be used by non-expert users as well as experienced engineers and speaks the language of Naval Architects. It allows also to easily set up self-propulsion simulation with the Virtual Disk model.
I hope this has been useful and can help you to decide what approach to use when it comes to simulating Hull Performance in Simcenter STAR-CCM+. As usual do not hesitate to reach out with any questions to support@volupe.com.