During the last week I stumbled on a great new feature in Simcenter STAR-CCM+! It was already released on version 2020.2 and gives XY plots a whole new additional layer of information: Bubble Plots. With this option you can show two additional scalar data series in one plot. One through the bubble size and one additional scalar by the bubble color.
Bubble Plot in Design Manager
Particularly in design exploration with the Design Manager, this plot option can be very handy when compiling visualization of results. With those additional layers you can comprise much more information in a single plot. To demonstrate this, I use one of the tutorial files from the Simcenter STAR-CCM+ manual, the Optimizing a Static Mixer. For this tutorial, a mixture of Oxygen and Nitrogen is passing through a static mixer. The aim of the optimization is to make the mixture as homogeneous as possible at the outlet, as well as minimizing the pressure drop across the pipe.
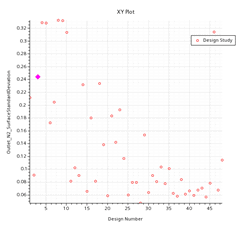
First thing to do is to create a XY Plot, for instance showing the objective performance of each design.
 You can then change the Render Mode to Bubble under the Design Study node. This provides you with a new sub-folder of Bubble Style. Change the Color Fill Mode from Constant to Variable and you will be able to change both Bubble Size and Color in the sub-nodes.
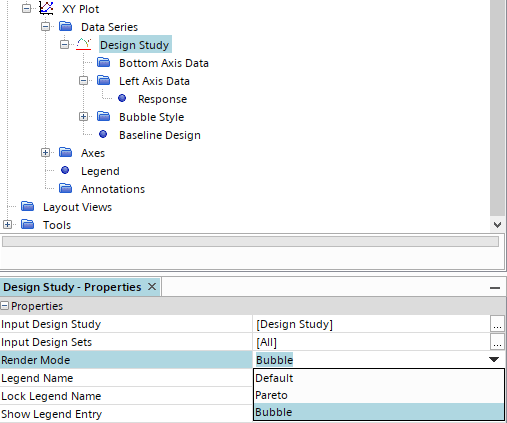
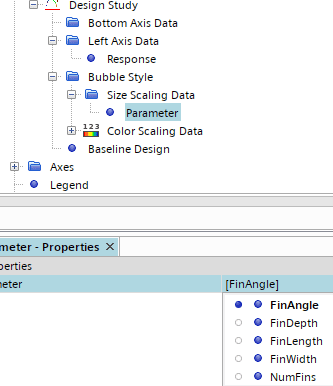
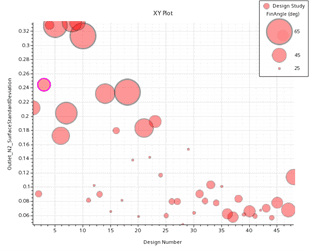
Under the Size Scaling Data folder, it is now possible to select among others Parameter, Response or Design Performance. Here case I use the geometry parameter of FinAngle:
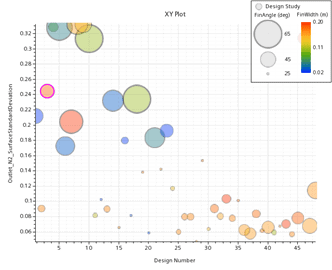
For the color scaling I use the geometric parameter FinWidth.
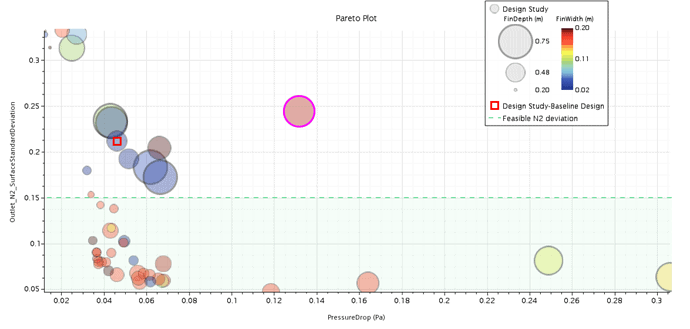
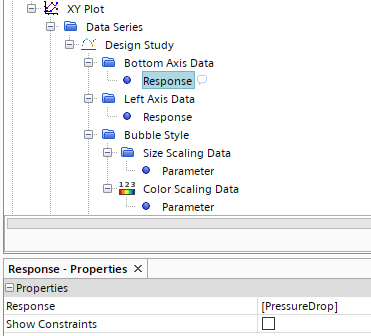
We can than change the Bottom Axis Data to plot a response. If you select the second objective, the pressure drop across the pipe,
and we´ll get a Pareto Plot.
With the size and color scale in one plot we can immediately see the connection of geometric parameters and the performance of our virtual prototype. In our case, the smaller the bubbles are the lower the variance of N2 concentration. And that the optimization algorithm favoured a higher FinWidth as those are clustered at the Parato Front.

I hope this week’s read will be helpful to you when analysing your design exploration such that you can make smart decisions, faster! Do not hesitate to reach out at support@volupe.com, if you have any questions.
read also:
HEEDS – Who wants innovation?
Star-CCM+ Job Scheduler
How to run Design Manager Projects
STAR-CCM+ field function syntax, part 2
Release of Simcenter STAR-CCM+ 2020.2 part 5