In this article, we explore a method that leverages the Refinement Level field function and a Field History monitor to track and visualize the mesh refinement changes. By using this approach, you can clearly identify areas of the mesh that have been refined or coarsened in the most recent Adaptive Mesh Refinement (AMR) event.
Understanding AMR and Refinement Levels
Adaptive Mesh Refinement works by adjusting the computational mesh during a simulation, dynamically refining or coarsening cells based on predefined criteria such as gradients in velocity, pressure, other scalar fields or pre-defined criteria for the VOF or overset interface. This process is essential for capturing finer details in complex flow regions while optimizing computational resources.
In Simcenter STAR-CCM+, the Refinement Level is a built-in field function that records how many times a cell has been refined from its original state. A higher refinement level indicates that a cell has undergone multiple refinements, whereas a level of zero means the cell remains in its original form.
However, visualizing which cells have been recently refined or coarsened is not straightforward, as Simcenter STAR-CCM+ lacks a native feature for tracking AMR events. Fortunately, we can create a workaround by storing the refinement level over time and comparing successive steps.
Tracking Refinement Changes Using Field History
The core idea behind visualizing recently refined or coarsened cells is to track the Refinement Level field function over time and calculate the difference between consecutive time steps. To achieve this, you can set up a Field History monitor to store the refinement level from previous time steps, and then calculate the difference between the current and previous refinement levels using a user-defined field function. This difference will highlight cells where refinement or coarsening has occurred.
Step-by-Step Implementation
Here is a step-by-step guide to setting up the visualization:
- Creating a Field History Monitor
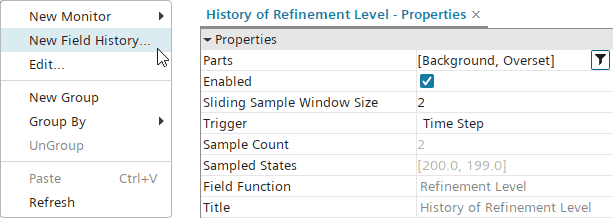
The first step is to create a Field History monitor to record the Refinement Level of the cells at each time step.
- Navigate to the Monitors tab in the simulation tree.
- Right-click and select New Field History Monitor.
- In the monitor’s properties, choose the Refinement Level field function as the quantity to monitor.
- Set the sampling frequency to match the frequency of AMR events or a desired time step interval.
This monitor will now store the refinement level values at each selected time step.
- Setting Up a User-Defined Field Function
Once the Field History monitor is set up, the next step is to create a scalar user-defined field function that calculates the difference between the current refinement level and the previously stored values. This function will highlight the cells where the refinement has changed.
- Define the function using a formula that subtracts the previous refinement level (stored in the Field History monitor) from the current refinement level. The formula will look something like this:


- Visualizing the Results
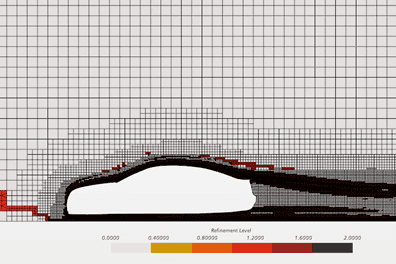
Now that we have a field function representing the change in refinement level, we can visualize it using the standard plotting and scalar field visualization tools in Simcenter STAR-CCM+.

Cells with positive values in the scalar plot represent areas that were refined in the last AMR event, while negative values indicate cells that were coarsened.
Benefits and Use Cases
This method for visualizing recently refined cells has several benefits, particularly when analyzing simulations with dynamic mesh adaptation:
- Tracking Refinement Patterns: You can easily track where and when refinements or coarsening occurred, which helps in understanding how the AMR algorithm responds to flow features over time.
- Debugging AMR Strategies: If the mesh is not adapting as expected, visualizing refinement changes allows you to diagnose potential issues with the AMR criteria or settings.
- Optimizing Mesh Performance: By identifying regions that frequently undergo refinement or coarsening, you can fine-tune the AMR algorithm to optimize performance, potentially reducing computational costs without sacrificing accuracy.
Limitations and Considerations
While this method provides a workaround for visualizing AMR events, there are some limitations and considerations to keep in mind:
- Memory and Storage: Storing field history data for large simulations or over many time steps can increase memory usage and storage requirements. Be mindful of how often you sample the refinement level to avoid excessive data generation.
- Time Step Selection: The accuracy of the visualization depends on how frequently you store the refinement level in the Field History monitor. If AMR events occur more frequently than your sampling, you may miss some refinement changes.
Conclusion
Although Simcenter STAR-CCM+ does not offer a built-in tool to directly visualize recently refined or coarsened cells during adaptive mesh refinement, the combination of the Refinement Level field function and a Field History monitor offers a practical solution. By tracking and comparing the refinement level over time, you can gain valuable insights into the dynamic behavior of your mesh and improve your overall simulation strategy.
This method not only helps you visualize the mesh evolution but also enhances your understanding of how AMR influences the accuracy and efficiency of your CFD simulations. If you have any questions, let´s discuss your Adaptive Mesh Refinement together, you reach us at support@volupe.com.
The Author
Florian Vesting, PhD
Contact: support@volupe.com
+46 768 51 23 46