Did you know that Simcenter STAR-CCM+ is capable of capturing the effect of capillary action and that it allows you to mimic the behavior of hydrophilic and hydrophobic materials? In this week’s blog post we will dig into the specifics of modeling surface tension dominated flows and how to incorporate wall adhesion effects in your simulation work.
Cohesion and adhesion
The phenomenon of capillary action is governed by cohesion and adhesion. Cohesion is the intermolecular force between identical molecules, tying them together by mutual attraction. Since these forces are an effect from molecular bonds, the cohesive forces differ between different substances. Water, for example, has strong cohesive forces thanks to a multitude of hydrogen bonds in the intermolecular structure. Adhesion, on the other hand, is the corresponding intermolecular force describing how different molecules are attracted to each other.
Surface tension, which is one of the key elements for capillary motion, is an effect of cohesion and adhesion. Whenever there’s a liquid–gas interface, surface tension results from the greater attraction of liquid molecules to each other (i.e. cohesion) than to the molecules in the air (i.e. adhesion). In short, cohesion keeps the liquid separated from the gas, surface tension makes it form into droplet shapes and adhesion makes the droplets stay in place (i.e. adhere to surfaces).
Surface tension and contact angle
In the context of Simcenter STAR-CCM+, these effects are taken into account through the inclusion of the “Surface Tension Force” model inside the “Multiphase Interaction” node, and the “Contact Angle” boundary condition in a Volume of Fluid (VOF) simulation.
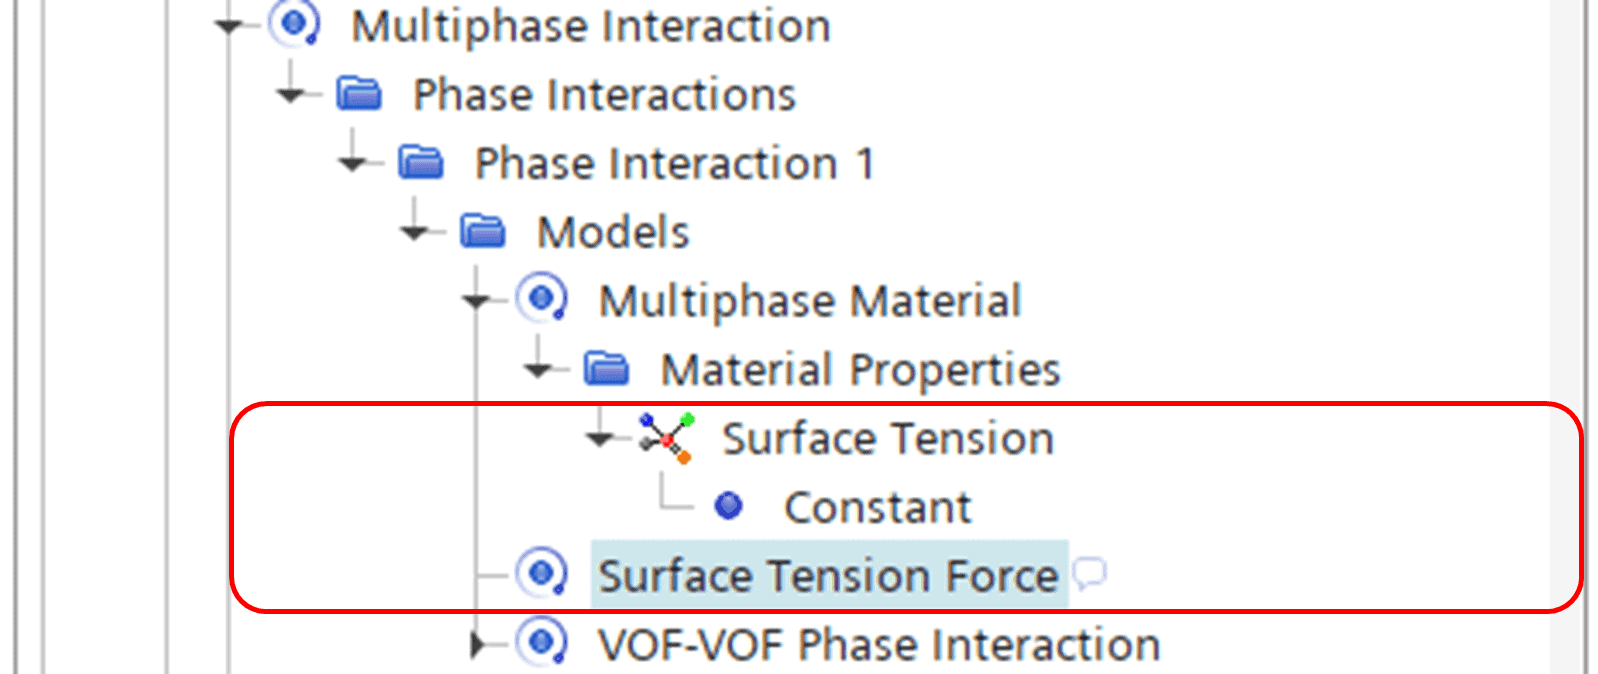
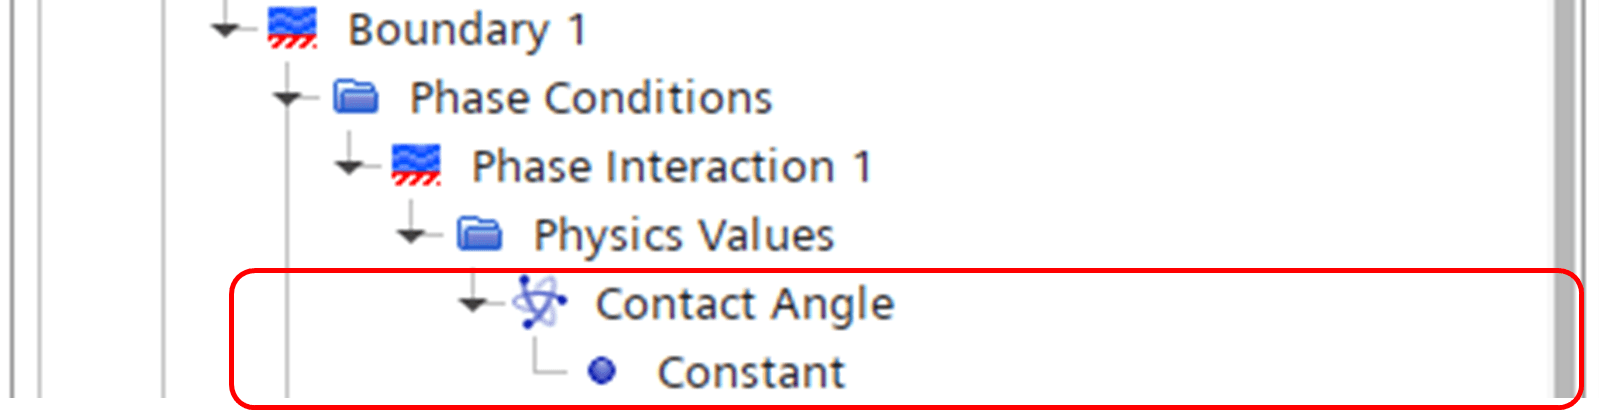
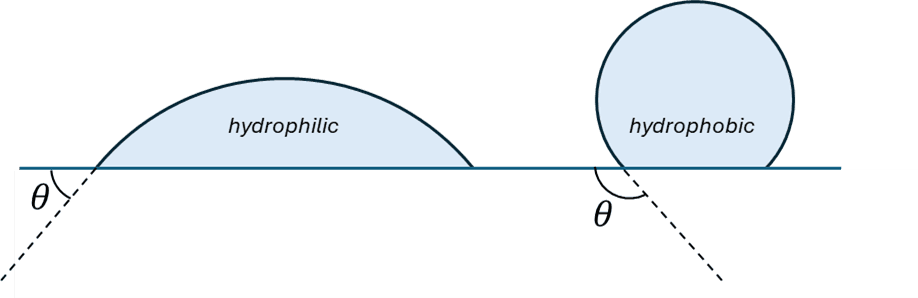
The contact angle, \theta, is used to describe the influence of wall interaction (i.e. adhesion) on the surface tension force. This is the parameter that allows us to describe hydrophilic or hydrophobic surfaces – a contact angle < 90° describes a hydrophilic surface, while a contact angle > 90° describes a hydrophobic surface (as depicted below).
Simulating capillary action
To demonstrate the effect of capillary action we will use a simple example. The basis for the simulation is a Volume of Fluid multiphase setup with water and air at default atmospheric conditions. We’ll consider a bucket partially filled with water and then dip a narrow straw into the water. The straw has an inner diameter of 4 millimeters and is submerged into the water by a total of five millimeters. Two different contact angles are used to model the effect of capillary rise and capillary fall, respectively:
- 60°, corresponding to a hydrophilic surface, and
- 120°, corresponding to a hydrophobic surface.
In these simple examples, the contact angle is defined with a constant value, but the contact angle may also be defined using e.g. a field function, tables or the so-called (Blended) Kistler correlation. The Kistler correlation is an empirical model which applies a so-called dynamic contact angle, which tends to work well for capillary-dominated flows. You can read more about this in the STAR-CCM+ User Guide (Contact Angle in Simcenter STAR-CCM+).
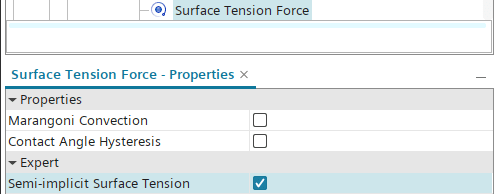
Within the Surface Tension Force model you can also include Contact Angle Hysteresis, enabling specification of advancing and receding contact angles to model more accurate droplet behavior on inclined surfaces. There’s also the possibility of including Marangoni Convection, allowing for spatial variation of surface tension.
An important distinction to make is that for Surface Tension dominated flows, it is recommended to enable the “Semi-implicit Surface Tension” setting in the Surface Tension Force model (see below). This setting adds an additional stabilization term to the momentum equations, improving robustness and allowing for larger time-steps.
According to theory, a hydrophilic surface should impose a capillary rise (i.e. an elevated free surface inside the straw) and vice versa. The animations below show the results from the two different setups.
As you can see the predicted capillary effects follow the theoretical hypothesis. So, how well does this correlate with reality?
The capillary rise (or fall) can be analytically described by Jurin’s law, defined as
h = \cfrac{2\gamma cos \theta}{\rho g r}where h is the height difference between the inner and outer free surface, \gamma is the surface tension, \theta is the surface contact angle, \rho is the liquid density, g is the gravitational acceleration and r is the tube radius. The plot below shows a comparison of the free surface offset for the case with a 60° contact angle (the leftmost animation above) and the analytical offset based on Jurin’s law.
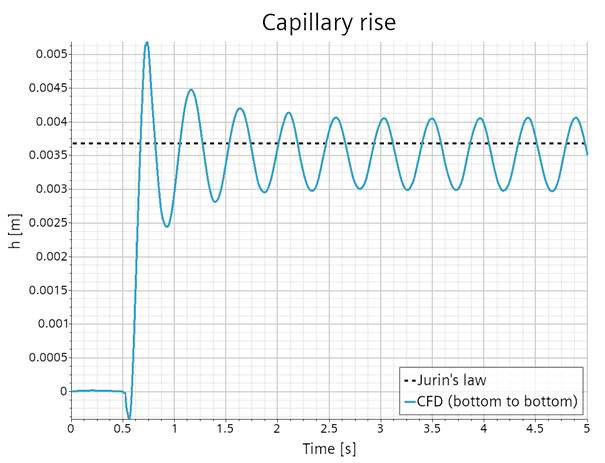
Just as indicated in the animation, the CFD simulation plot shows an oscillating behavior of the free surface. However, the predicted offset clearly oscillates around the analytical offset, although the CFD prediction shows a slightly lower mean value (about 95% of the analytical height difference). The slight underprediction is likely explained by the discretization in STAR-CCM+. In this particular case we made use of the newly released feature “Virtual Body” to submerge the straw into the water. You can read more about this feature in this blog post from a few weeks ago New CAD And Mesh Features In Simcenter STAR-CCM+ 2502 – Volupe.com. If you want to know more about modelling capillary effects, there is also a tutorial available in the user guide (Tutorial: Capillary effects).
Simulating hydrophilic and hydrophobic surfaces
We will now use another set of simulations to exemplify the modeling of hydrophilic and hydrophobic surfaces in Simcenter STAR-CCM+. The setup consists of a pipette-like nozzle with a 4-millimeter opening diameter, slowly seeping tiny droplets onto a surface 60 millimeters below. Two different contact angles have been used in the setup:
- 60°, corresponding to a hydrophilic surface, and
- 150°, corresponding to a hydrophobic surface.
The animations below show how the dripping water behaves as it interacts with the different surface conditions.
As you can see, the water landing on the hydrophilic surface (left) slowly agglomerates and forms a flat puddle that grows larger and larger, thanks to the adhesive contact with the surface. Conversely, the water landing on the hydrophobic surface (right) tends to rapidly retract and form droplet-shaped entities that wander off along the surface.
I hope this was an interesting read and gave some new insights into the multiphase capabilities in Simcenter STAR-CCM+. As always you are welcome to send any questions or comments to support@volupe.com.
Author

Johan Bernander, M.Sc.