Boundary conditions make our simulations specific to our problem statement. If you want a specific profile of the velocity as input to your simulation (e.g. from test data for example), it is good to know how to import this boundary condition as a table. In this week’s blog post we will show you how to:
- Import a table for a velocity profile at an inlet.
- Visualize the boundary condition in a plot.
- Verify that the boundary condition is used in the simulation.
- Some tips and tricks if receiving an error message when importing tables.
Making sure the .csv format is correct
The table used for importing the boundary condition values is recommended to be stored in a file with “.csv” format. The lines in the file should have a separation with only a comma sign, and no spaces, see picture below.
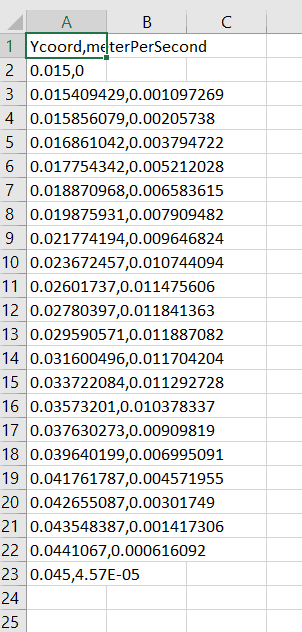
Note that the decimal sign can vary due to which language setting you have on your computer. Simcenter STAR-CCM+ will use a dot as decimal sign, therefore we recommend you using the same. If you want to know the format of a table on your computer, you can always create a table in Simcenter STAR-CCM+ and export it, to see which format to use.
Import the table into Simcenter STAR-CCM+
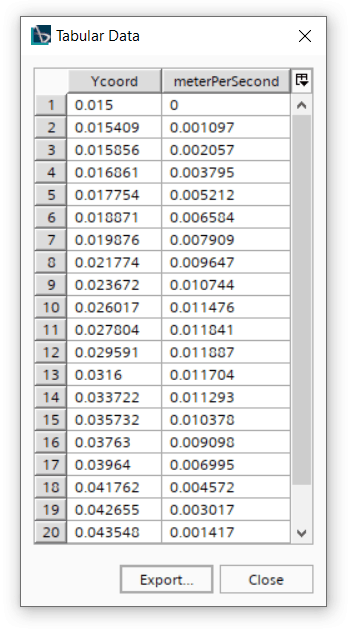
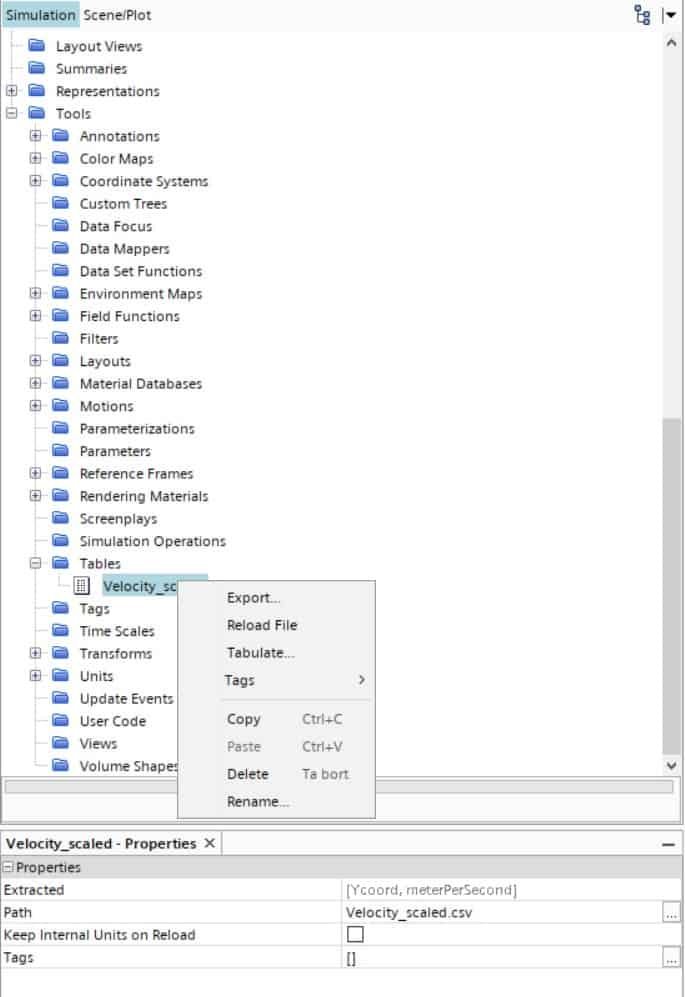
To import a table into Simcenter STAR-CCM+, go to Tools -> Tables, right-click on Tables, select New table -> File table, and import the wanted file. Right-click on the imported table and choose Tabulate to visualize the imported table as the picture below is showing.
If you need to update the importation, or if something seems wrong, right-click on the table and select Reload file. How to find the different choices for a table is visualized in the picture below.
Create a field function
Right-click on Field functions (under Tools) and create a new field function. We will use the function Interpolate table to use the values from the table to create interpolated values of the velocity for locations in y-position. The syntax for the field function is:
interpolateTable(@Table(“Velocity_scaled”),”Ycoord”,SPLINE,”meterPerSecond”,$${Position}[1])
In this example:
- The name of the table is Velocity_scaled,
- Ycoord is the name for the first column in the .csv file (corresponding to y-position),
- SPLINE is the interpolation method creating values between the discrete points specified in the table,
- meterPerSecond is the name of the second column in the table (corresponding to the velocity magnitude),
- Position 1 is stating that the position coordinate is aligned with the y-axis (1=y-direction, if you want x-direction that is corresponding to the value 0, and if you want z-direction that is corresponding to the value 2).
If there is an error when reading in the table, this can be due to the naming of the columns in the .csv file. If getting errors like this, due to the symbol before the first column named Y, try changing the column name and reload the file for the table (described in the previous step):
Found 2 columns while importing table Velocity_scaled.csv: ”¤Y”,”meterPerSecond”
Error: function ‘velocity_inlet_profile (velocity_inlet_profile)’ compilation error: syntax error
Unable to compile expression “interpolateTable(@Table(“Velocity_scaled”),”Y”, SPLINE},”meterPerSecond”,$${Position}[1])”
We at Volupe have previously created blog posts about how to define field functions, please take a look at the two linked blog posts below if you need some tips on how to create field functions.
https://volupe.com/blog-volupe/star-ccm-field-function-syntax-part-1/
https://volupe.com/blog-volupe/star-ccm-field-function-syntax-part-2/
Set the field function as a boundary condition
On the Region level you should specify boundary conditions for all boundaries. The default boundary condition is wall, and when you change the boundary type for the inlet to Velocity inlet (used in this example), you can change the Velocity magnitude method (under Physical values) to Field function. Here you can now choose the field function you created in the previous step. This step is done previous to plotting the table in Simcenter STAR-CCM+ since we will plot the region value in the plot (therefore we must first assign a value to the region).
Plot the table
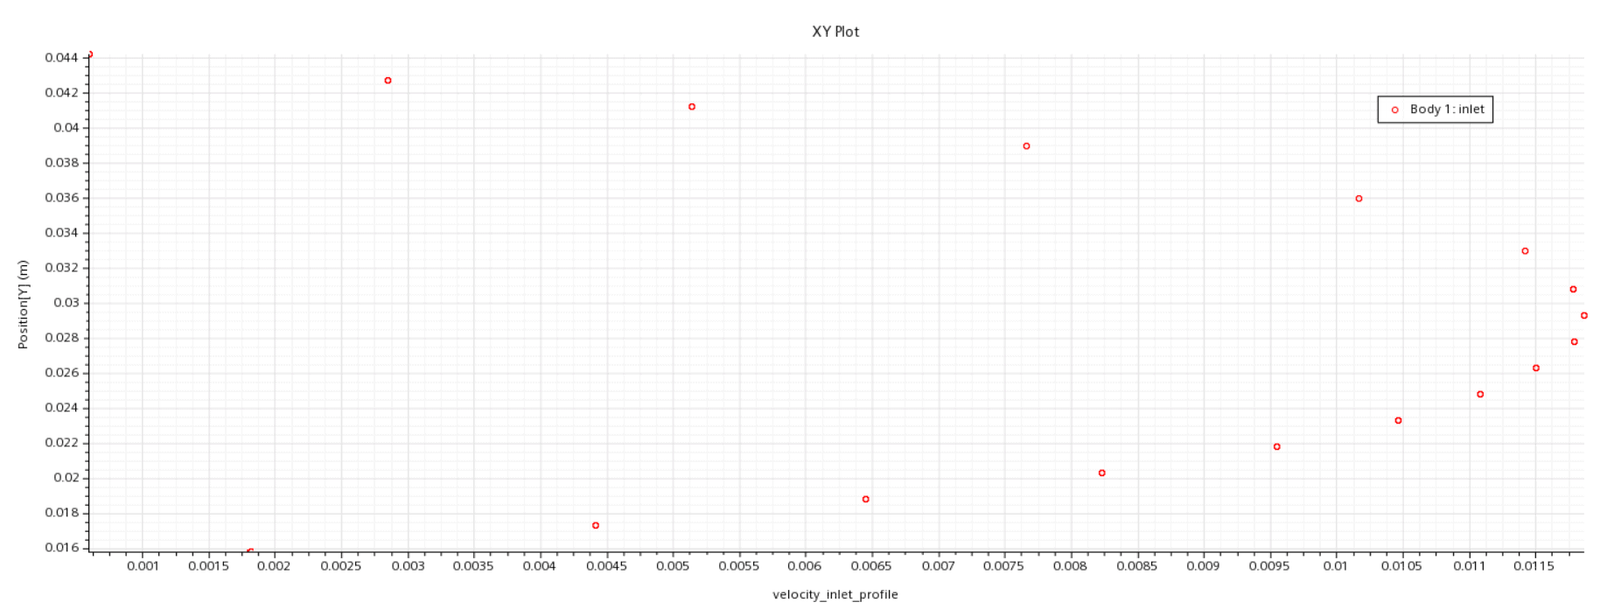
Create a new plot, with the Parts chosen to Inlet (right-click on the plot, edit, parts). Select the x-type to be the scalar function you created and the y-type to be position (in this case y-position). The plot, see example plot below, will be using the cell values of the mesh you have created for the region. The default data type for x-type is set to Direction, change this to Scalar. If you can not find your field function as input for the Scalar function, double check so you are not receiving any error statement when defining the field function.
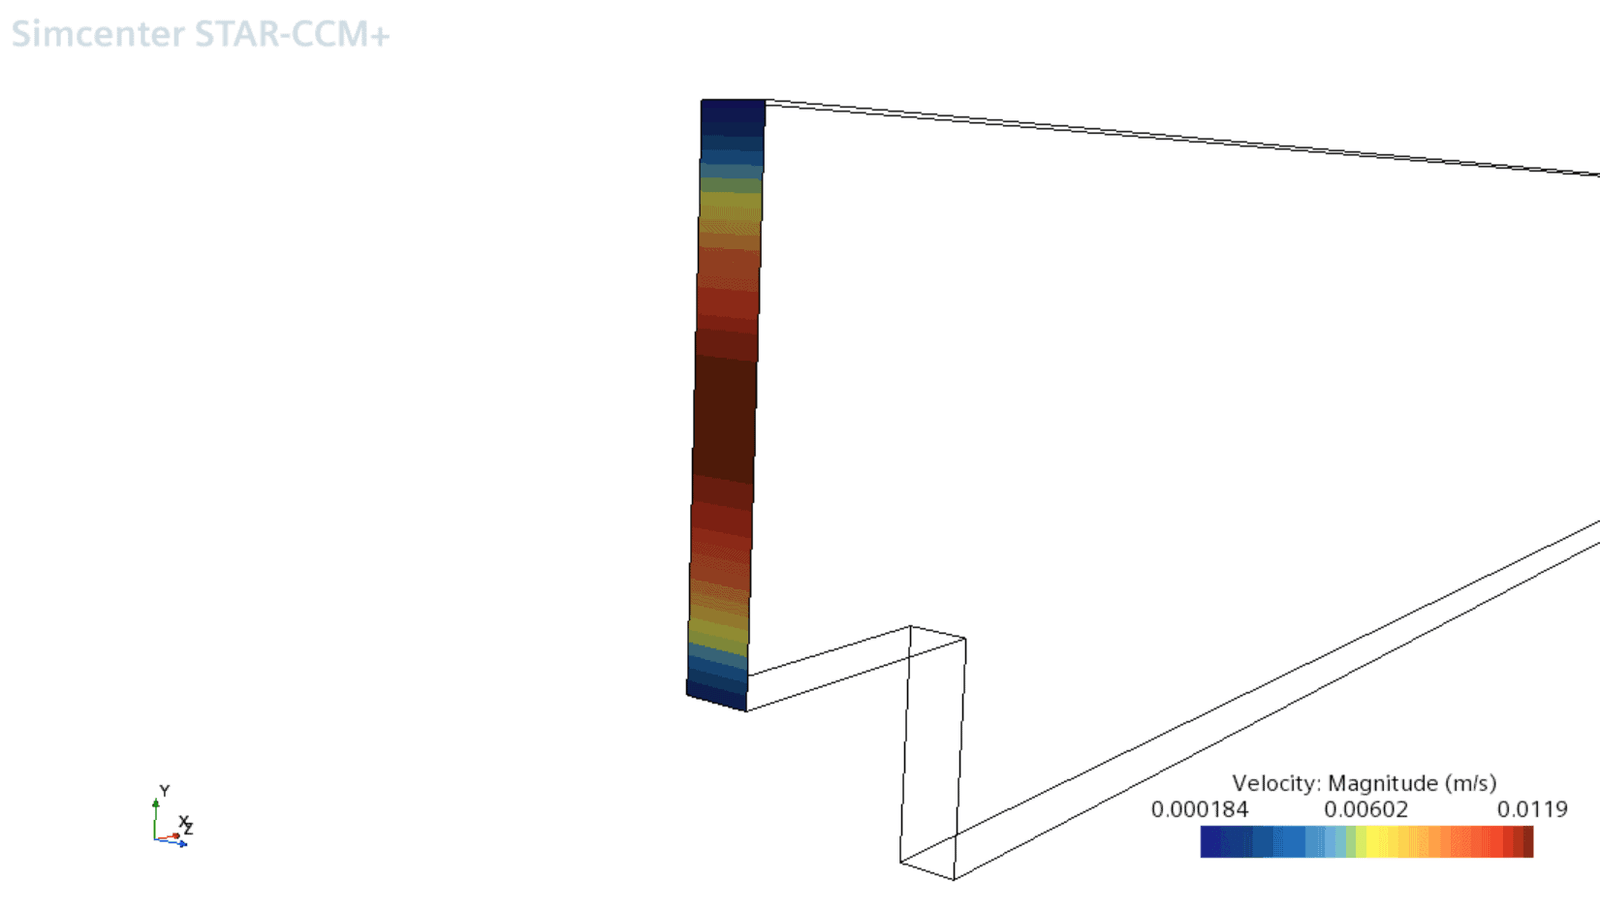
Validate that the boundary condition is used
To validate that you are using the velocity profile, plot a scalar scene with the velocity for the inlet and compare the scene if you plot the field function on the inlet instead. The plot should not change.
We at Volupe hopes that this blog post will help you as a CFD engineer in your daily work. One thing to note is that there are several different ways to specify a velocity profile as inlet boundary condition, the approach in this blog post uses field functions. If you rather use tables, please look at this video tutorial from Siemens: https://support.sw.siemens.com/en-US/product/226870983/knowledge-base/KB000041469_EN_US?pid=sc%3Apc-typeahead&index=content-external&audience=external .
If you have any questions about your simulations, please send an email to support@volupe.com. Have a great weekend!