In this blog article we have a closer look at how the flow and resulting pressure drop in internal flow systems behave when shorter pipes and bends are connected in close proximity to each other. In general, 1D CFD tools make use of empirical loss coefficients to determine the resistance experienced by the fluid when passing through a ball valve, a 90 [°] bend, or a flow junction, to name a few examples. These loss coefficients are typically derived from experimental or numerical methods where the flow is allowed to become fully developed before entering and after leaving a component. Ensuring that the pipes connected to both the inlet and outlet are sufficiently long to attain stable flow conditions before the measurements points is a sound approach for carrying out these experiments. However, the resulting loss coefficients are then reliant on these conditions and any simulation carried out with these will carry the assumption of fully developed flow both upstream and downstream a component. In many engineering applications, bends, valves and junctions are connected close to each other in such a way that the condition of fully developed flow is never reached. In such situations the resulting pressure drop calculations tend to be more conservative as the flow interaction between components is not accounted for correctly.
To consider these effects, Simcenter Flomaster has been designed to account for the changes that occur to component loss coefficients when other components are positioned in close proximity. The tool searches for groups of potentially interacting components whose interaction coefficients depend only on the geometrical configuration of the component and flow direction. Having calculated all the interaction coefficients for the relevant components, the program then proceeds with a normal Steady State simulation.
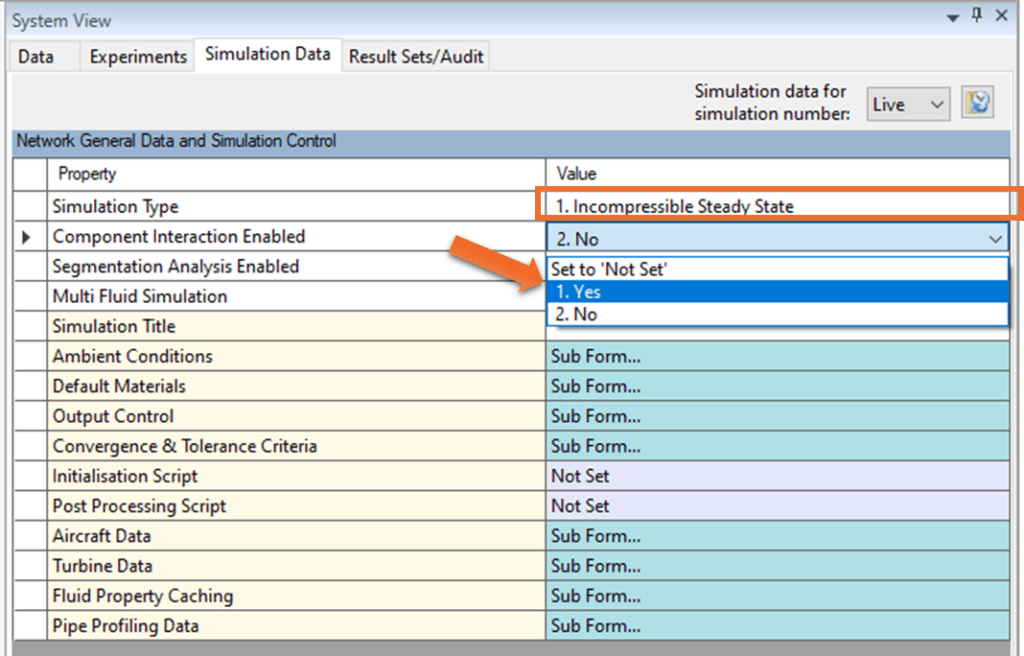
The option for enabling “Component Interaction” is found under the Simulation Data tab and the approach is available for Incompressible Steady State and Heat Transfer Steady State simulations.
In practice, if a system includes two components in close proximity, it is likely that there will be other components in the system which interact as well. The procedures in Simcenter Flomaster have been designed to model multiple interactions in a systematic manner which is physically reasonable but which does not exaggerate interaction effects.
In general, the total loss coefficient will not be the sum of two individual loss coefficients if they are placed closely to each other because of the three different types of interaction:
- Part of the loss associated with redevelopment of the flow after the first component does not occur. Generally, this is seen when having an insufficient length of pipe downstream of a bend for example. For the flow to become fully developed in some cases as much as 30 pipe diameters in length may be required to be certain that no component interaction occurs.
- The first component affects the inlet flow conditions to the second component, such as flow from bend-to-bend or bend-to-junction. The interaction between two subsequent bends is shown in more detail further down this article.
- The static pressure distributions may interact and alter the flow patterns in both components.
Simcenter Flomaster accounts for these interactions by determining a new effective loss coefficient through modifying the components non-dimensional loss coefficients using a correction factor. In some cases this is also achieved by modifying parameters related to the component, such as the ratio between length and diameter, in order to obtain a new loss value.
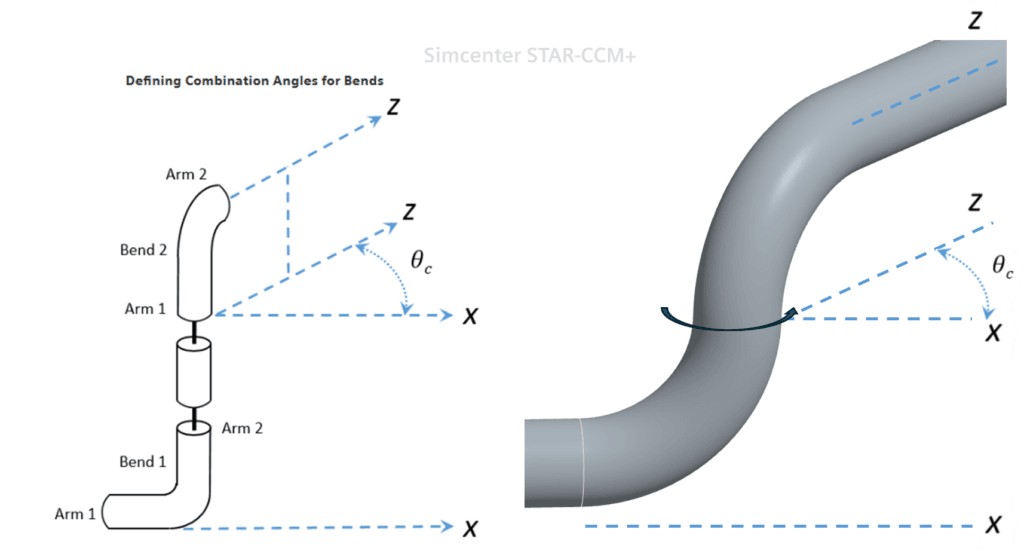
The impact of the interaction will also depend on how components are connected to each other and what the geometrical relationship between them looks like. For example, flow through two 90 [°] bend segments, connected as shown below, will have a significantly different flow profile compared two bends forming a U-shape using a Combination Angle (θ) of 180 [°].
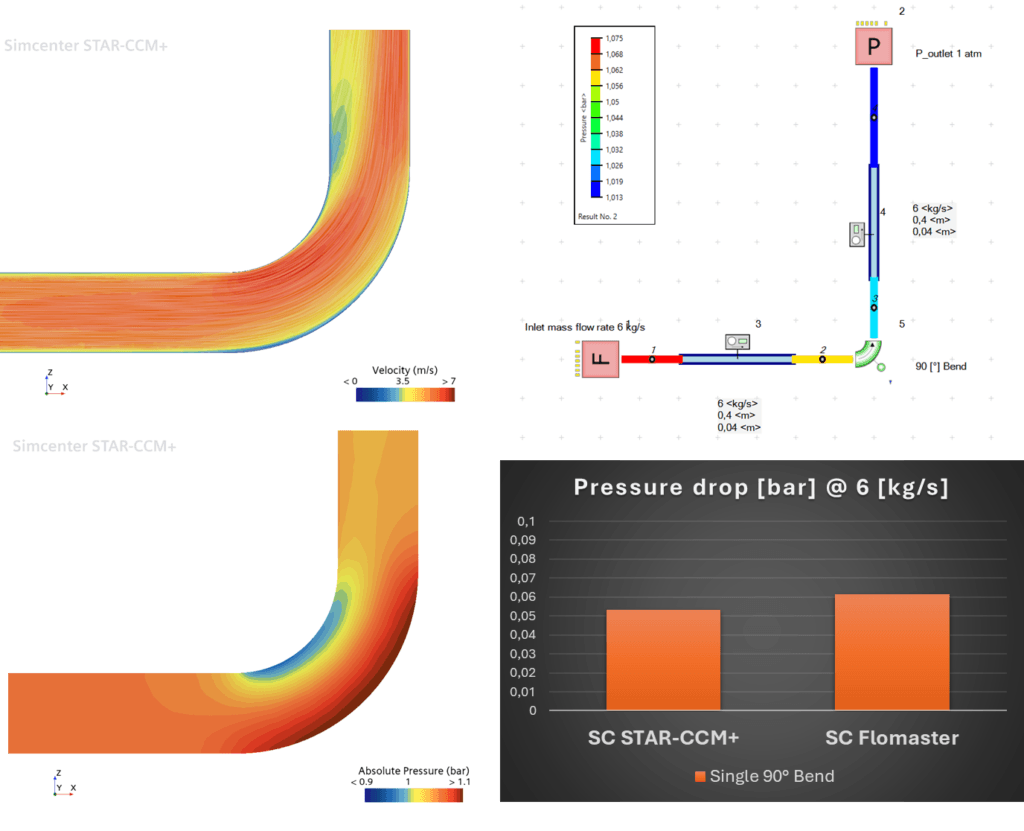
Now, let us have a closer look at how Simcenter Flomaster predicts the interaction and losses between two closely placed bends, and compare these findings with results from Simcenter STAR-CCM+. To begin with, a base line case was run using a single 90 [°] bend having an internal diameter of 0.04 [m] and bend radius of 0.07 [m]. Connected to this bend were two pipes with the same diameter and each with a length of 0.4 [m]. Water was allowed to flow through the pipe with a mass flow rate of 6 [kg/s], and an outlet pressure of 1 [atm] was used.
Flow enters the bend in a uniform manner, as the flow is turned 90 [°] flow separation occurs at the bend’s inner radius. Along with the velocity vectors and absolute pressure, the overall pressure drop calculated by the two tools is presented below. This will act as a reference to the subsequent simulations where an additional bend is placed adjacent the original bend.
Continuing with the same geometrical specifications, an identical 90 [°] bend was connected to the existing bend. The Component Interaction option was enabled under Simulation Data to account for flow interaction between the bends. To study the impact of using different arrangements for connecting the two bends, the Combination Angle (θ) of the second bend was specified using the following angles: 0, 90, and 180 [°]. Thereby rotating the second bend in relation to the first bend.
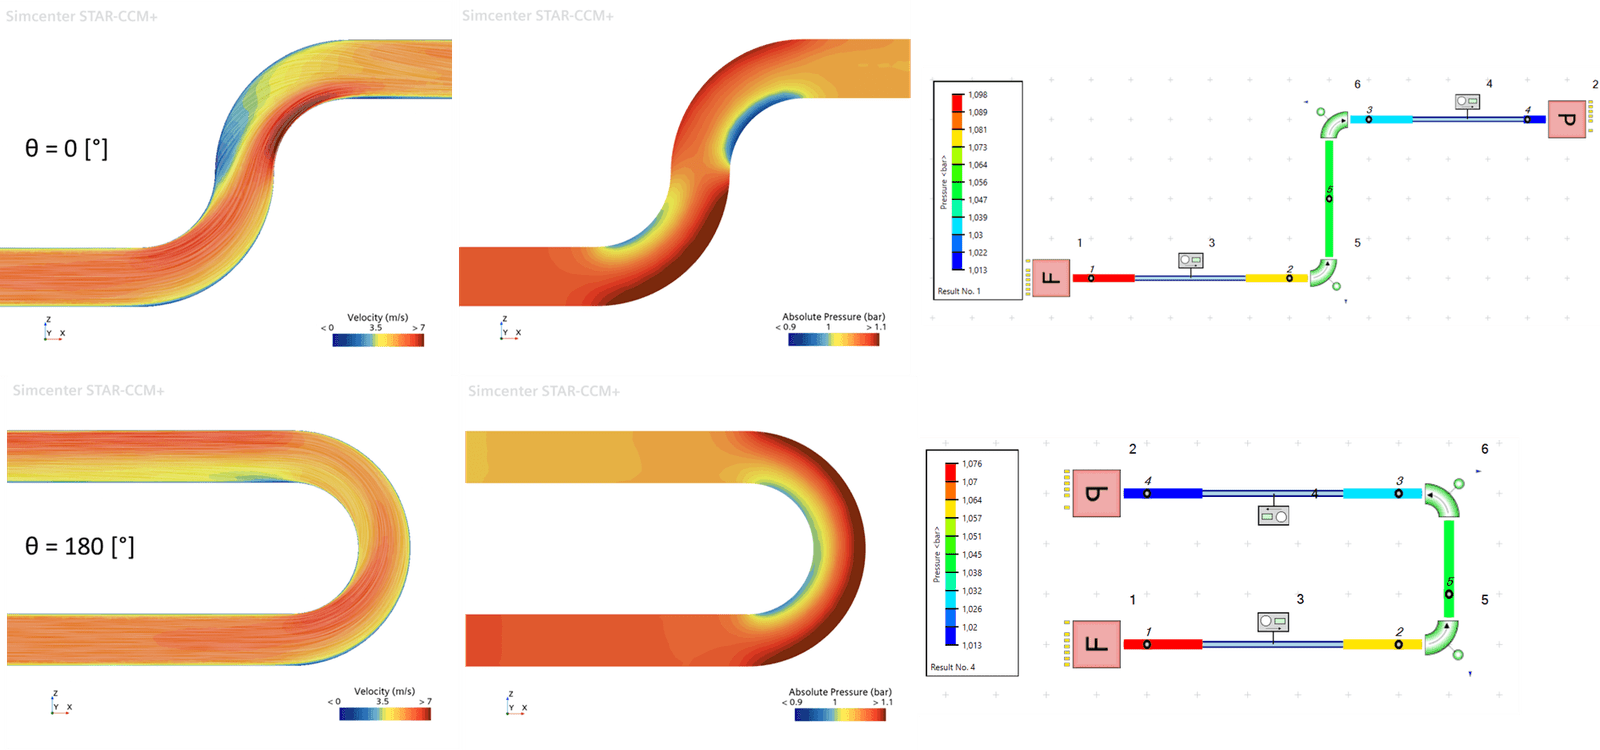
Above the cases θ = 0 [°] and θ = 180 [°] are shown to illustrate the flow and pressure behavior along the pipes. The S-shaped arrangement leads to higher losses compared to the smoother transition of the U-bend with less boundary layer separation from its walls. Both cases exhibit flow different from the case using a single 90 [°], where the S-bend clearly shows that the inflow into the second bend depends greatly on the outflow of the first bend. The U-bend provides a more uniform profile, and although the two bends depend on one another, the flow profile is more similar to the single 90 [°] bend than the S-bend.
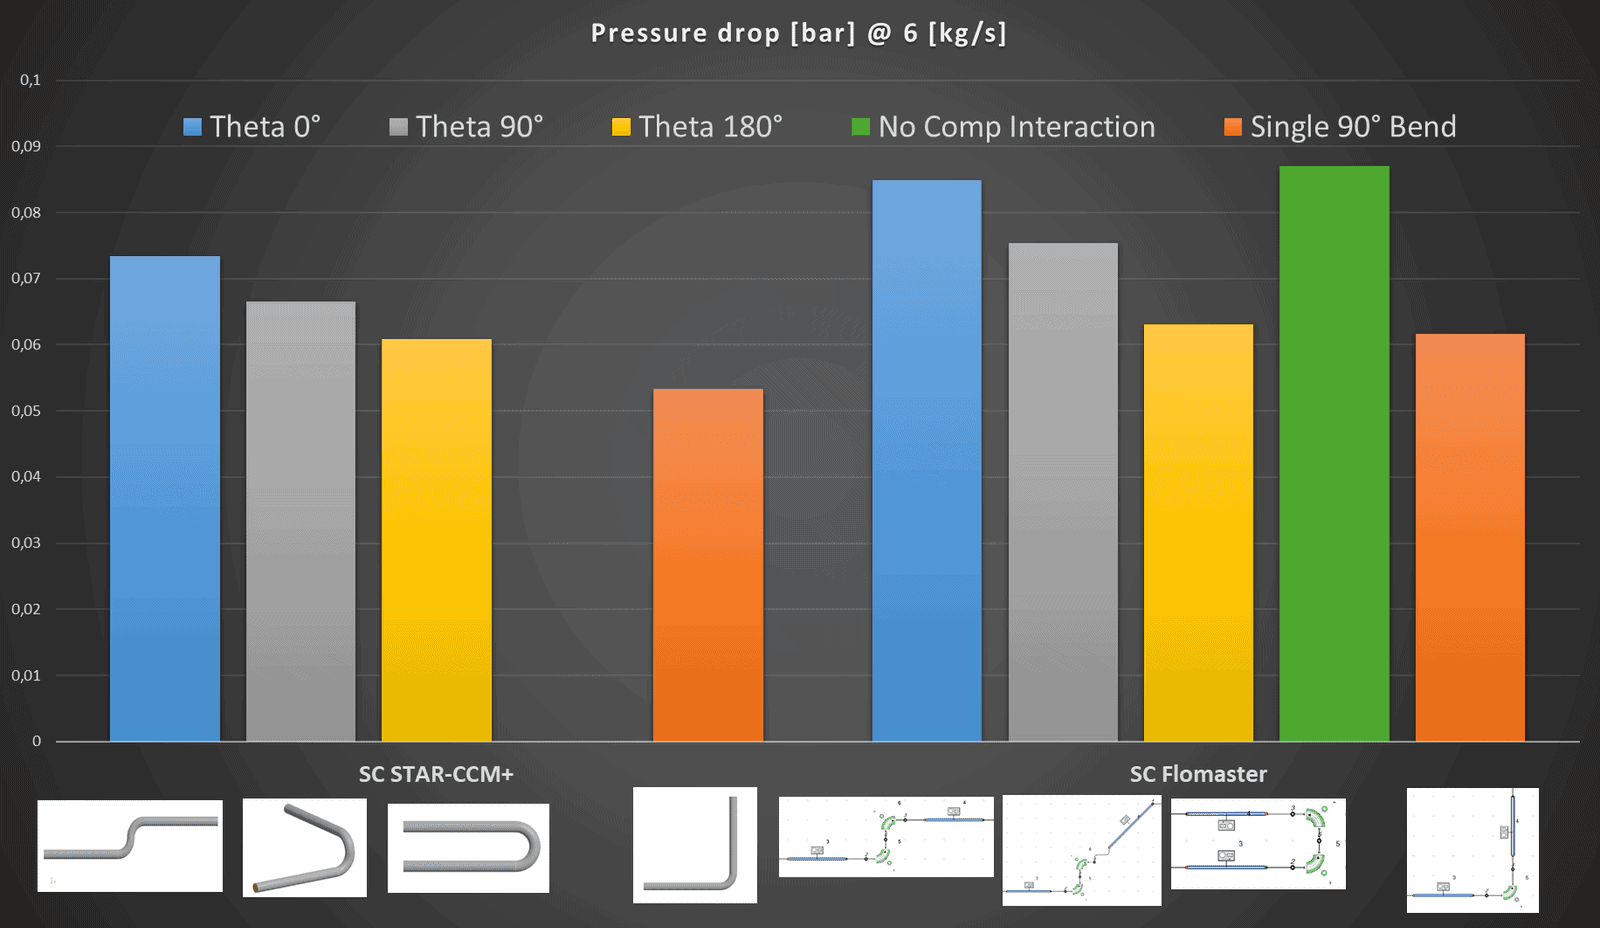
Below, the results from the comparison have been summarized. On the left hand side, results from Simcenter STAR-CCM+ are given, and to the right, results from Simcenter Flomaster. Overall, the trend of decreasing pressure drop caused by an increase in rotational angle (θ) seem to match between the two simulation tools. Given that component interaction is enabled and accounted for in Simcenter Flomaster. For comparison, the connected 90 [°] bends were also run with the component interaction disabled (green), and by so doing, summing the pressure loss from each individual bend. In this case, a seemingly conservative estimate for pressure drop is obtained if the intention was to model a U-bend (θ = 180 [°]), making it clear that care should be taken to account for flow interaction in situations where underlying flow assumptions, from which a component’s loss coefficients where derived, are no longer valid.
We hope you have found this article interesting. If you have any questions or comments, please feel free to reach out to us at support@volupe.com
Author
Fabian Hasselby, M.sc.