What’s New?
With the latest update to Simcenter STAR-CCM+ Design Manager, you can now fully explore how your designs perform across all Pareto ranks, not just the top rank. The new “Show All Non-Dominated” toggle adds critical depth to your analysis by revealing the broader structure of the trade-off surface.
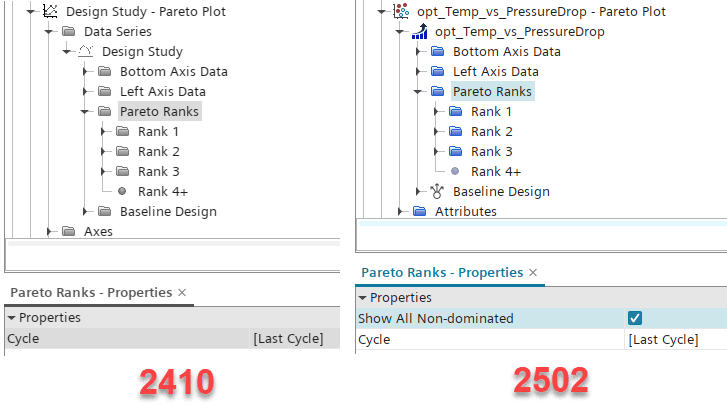
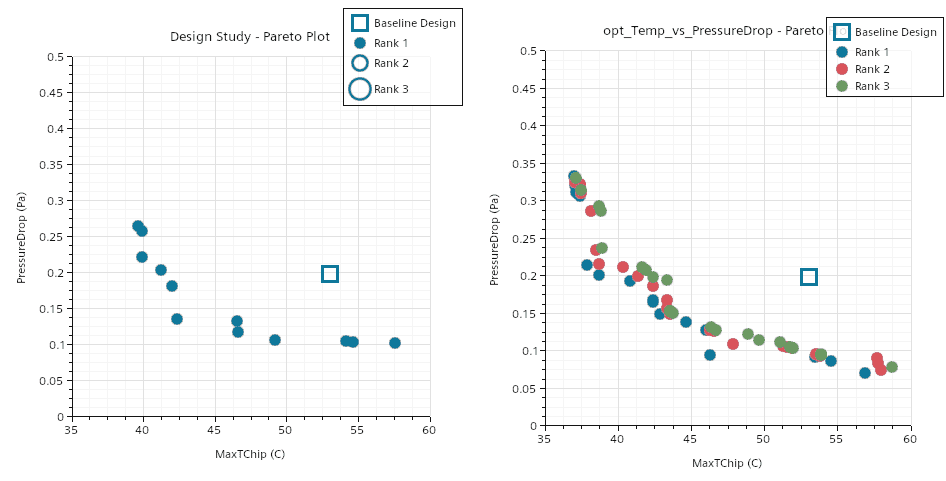
Previously, the pareto front was displayed by the points only of rank 1 of the current non-dominated front. But now, you can see designs from Ranks 1, 2, and 3, all of which are non-dominated within their respective layers.
How It Works: Use Cases Explained
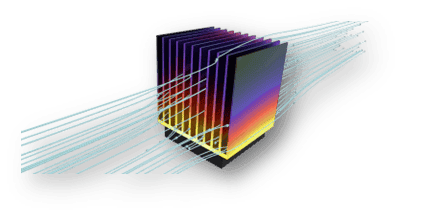
In multi-objective optimization, you’re often trying to improve two or more conflicting goals at once , for example, reducing pressure drop while increasing cooling of a heat sink. To demonstrate the impact of the Show All Non-Dominated feature, we applied it to a passive heat sink design scenario using a multi-objective optimization approach in Design Manager. We start with a 3D-CAD parametric model of a passive heat sink designed for cooling a CPU chip. The heat sink is placed inside an air tunnel, and its shape is defined by 8 design parameters, including number, spacing, and thickness of cooling fins. These parameters were varied across many design candidates using Design Manager’s optimization study, employing the SHERPA algorithm.
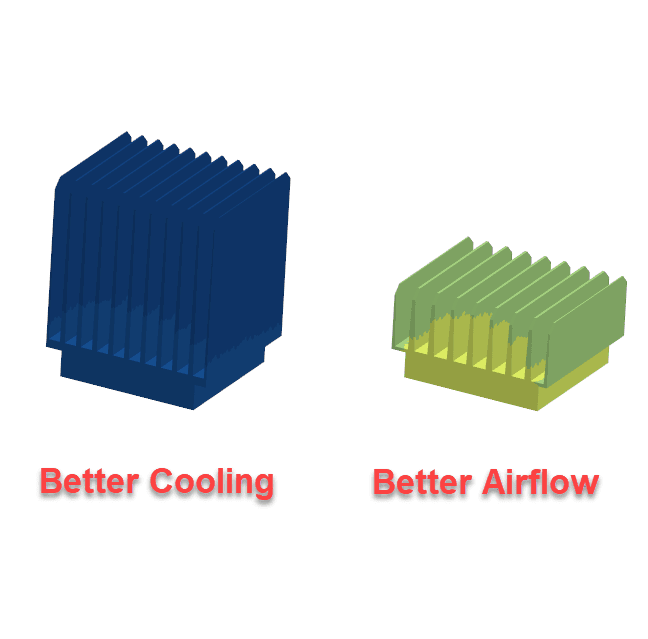
This is a classic multi-objective problem with competing goals:
- Minimize CPU temperature (maximize cooling performance)
- Minimize pressure drop across the air tunnel (ensure airflow efficiency)
Improving one often worsens the other. A denser fin array, for example, may cool better but increase flow resistance. As expected, the optimization produced a set of trade-off designs, some better at cooling, others better for airflow.
This is where the new Show All Non-Dominated feature adds major value. We can derive not just the Rank 1 designs (current Pareto Front), but also Rank 2 and 3 designs that were competitive and informative for engineering decision-making. To fully understand the benefits with this new option, we need to recap the what the ranks are. Variants of an optimization are automatically grouped into four design sets:
- Rank 1: The true Pareto Front — designs that aren’t dominated by any others.
- Rank 2: The next layer of non-dominated designs after removing Rank 1.
- Rank 3: Non-dominated once Ranks 1 and 2 are excluded.
- Rank 4+: Designs that are dominated multiple times over. These are hidden by default
Each optimization cycle produces new designs. The Pareto ranks, however, are assigned across the entire history of the study, not just one cycle. That means:
- A design from Cycle 3 and another from Cycle 7 can both belong to Rank 1 if they’re non-dominated in the global context.
- Conversely, a design that appeared strong in an earlier cycle (e.g., non-dominated within Cycle 2) may be pushed down to Rank 3 or 4 once better designs show up in later cycles.
This also means that ranks are dynamic, they change as new designs are added and better trade-offs emerge. You might see a design:
- Start as non-dominated in an early cycle
- Get dominated later as the optimizer finds better solutions
- Fall to a higher rank or even become part of the Rank 4+ group
This is exactly why the updated feature in STAR-CCM+ is useful — it lets you focus on true non-dominated designs only, regardless of when they were evaluated. This reduces the risk of potentially valuable designs are being left out. And avoids being misled by early “good-looking” variants that were later dominated. You´ll get deeper understanding how your optimization study evolves over time is crucial. The updated plot lets you monitor rank changes over multiple optimization cycles, helping you detect convergence patterns earlier.
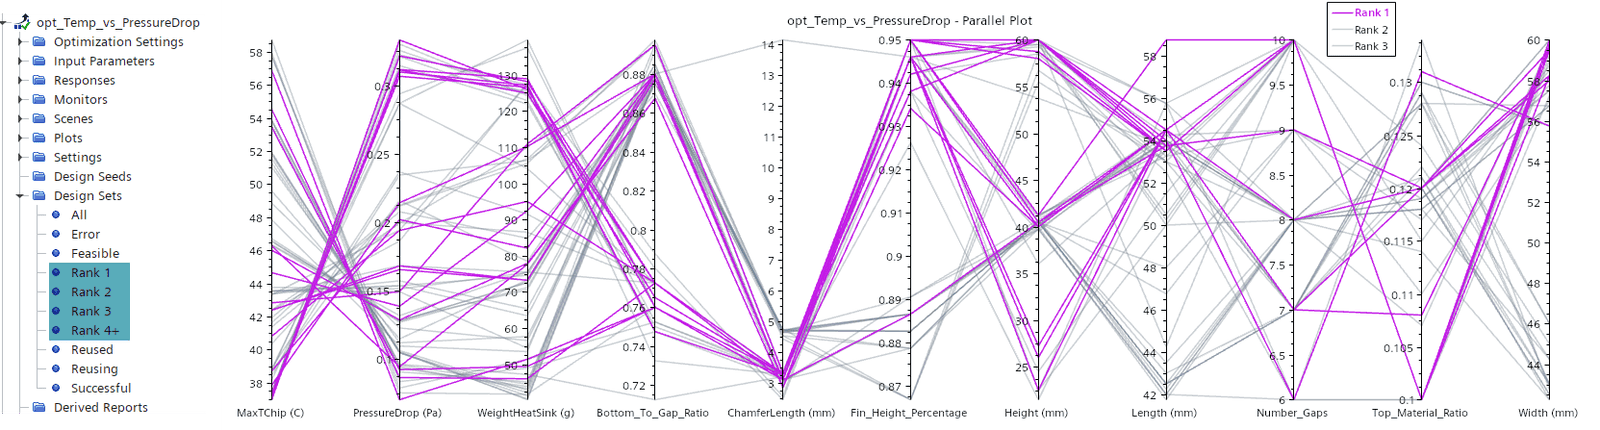
The ranks are automatically grouped into four default design sets of an optimization study. This allows us to adjust the plots like the parallel plot with ease to get a better understanding of the performance and the parameters. In the example below we can easily distinguish the variants from Rank 1 and understand that all follow a specific path for the parameters of width, length and chamfer length.
Additionally, we could pause and later resume a study, while previous cycle ranks are preserved and displayed. As new designs are added and the algorithm runs, the ranks and plots update accordingly, ensuring consistency and traceability.
Why It Matters
These upgrades aren’t just cosmetic—they bring real, practical advantages to your design exploration workflow. By revealing a more complete view of the Pareto Front, you can make better-informed decisions and uncover trade-offs that might otherwise go unnoticed. The ability to export non-dominated designs with a single click streamlines collaboration and analysis, while the clearer visualization of rank evolution helps you track convergence and understand how your design space is progressing. Whether you’re optimizing for performance, efficiency, or balancing multiple objectives, these new tools give you the clarity and control to move forward with confidence.
The Author
Florian Vesting, PhD
Contact: support@volupe.com
+46 768 51 23 46