Reynolds number calculator
Find the Reynolds number and the flow regime of a pipe or duct, a flat plate, a cylinder or a sphere, with air and water properties at your temperature.
Reynolds number and flow regime calculator
It opens on water at 20 °C in a 25 mm pipe at 1 m/s. Change any input and the result follows.
Reynolds number formula
The Reynolds number equation (1) gives the ratio of the inertial forces in a flow to the viscous forces [1]. Here ρ is the density of the fluid (kg/m³), U the flow speed (m/s), L a characteristic length (m), μ the dynamic viscosity (Pa·s) and ν = μ/ρ the kinematic viscosity (m²/s).
Whether your flow is laminar or turbulent depends on Re, on the shape and on what the flow has met upstream.
Which length to use
A regime limit only holds for the length it was given for. That is the inner diameter D of a circular pipe, not the nominal pipe size, and the hydraulic diameter Dh of any other duct (see Pipes and ducts). A flat plate uses the distance x from the leading edge, which gives the local Rex, and a cylinder or a sphere in a free stream its diameter. For anything else, such as a wing or a vehicle, use the length that the data you compare with are based on, and say which one you used.
Dynamic and kinematic viscosity
Data sheets give the viscosity in two forms. The dynamic viscosity μ is in Pa·s, often as mPa·s or centipoise (1 cP = 1 mPa·s), and the kinematic viscosity ν = μ/ρ in m²/s, often as mm²/s or centistokes (1 cSt = 1 mm²/s = 10⁻⁶ m²/s) [2]. Water at 20 °C has μ = 1.002 mPa·s and ν = 1.003 mm²/s [3, 4], two numbers that look almost the same. Air at 20 °C and 1 atm has a dynamic viscosity 55 times lower than water, μ = 1.813 × 10⁻⁵ Pa·s, but a kinematic viscosity 15 times higher, ν = 1.506 × 10⁻⁵ m²/s. This means that at the same speed and size, air gives you a Reynolds number 15 times lower than water.
The usual slip is a kinematic viscosity typed in cSt with m²/s selected, which makes Re a million times too small, or a kinematic viscosity typed into the μ field. The calculator checks for both and offers you the fix in one click.
How to calculate the Reynolds number
Take the case the calculator opens with, water at 20 °C flowing at a mean speed of 1 m/s through a pipe with an inner diameter of 25 mm. With ν = 1.0034 × 10⁻⁶ m²/s, equation (1) gives Re = UD/ν = 1 × 0.025 / (1.0034 × 10⁻⁶) = 2.49 × 10⁴, or about 24 900. The density form gives the same number, Re = ρUD/μ = 998.2 × 1 × 0.025 / (1.0016 × 10⁻³) = 2.49 × 10⁴.
Flow at this Reynolds number is turbulent in any ordinary pipe. Laminar flow at 2.49 × 10⁴ has only been kept in experiments built to keep disturbances out [10]. If you want laminar flow in this pipe, stay below about 2000, where turbulence dies out on its own [11, 12]. Here that means a speed below about 0.08 m/s.
The units cancel, as you can check on the density form. ρUL has the units kg/m³ × m/s × m, and μ has Pa·s, which is kg/(m·s), so the ratio is a pure number [2]. Re is dimensionless, and it comes out the same in SI and US units as long as you convert every input consistently.
Laminar vs turbulent flow
In laminar flow, sometimes called streamline flow, the fluid moves in layers that slide past each other without mixing. Turbulent flow mixes the layers through eddies and swirls, with velocities across the main direction of flow, and it resists the flow more [13]. Which one you get depends on the Reynolds number, on the shape and on how disturbed the flow is. Pipe flow is laminar below about 2000 and turbulent above about 3000, with either possible in between [12, 13]. The calculator draws its transitional band from 2300 to 4000, with some margin.
Osborne Reynolds showed the two kinds of flow in 1883 [14]. He drew water from a large tank through glass tubes with trumpet-shaped inlets and let a streak of coloured water enter with it. At low speeds the streak ran as a straight line through the whole tube. When he raised the speed in small steps, the colour band at some point well downstream of the inlet suddenly mixed with the water around it and filled the rest of the tube, and in the light of an electric spark the coloured water showed up as curls, the eddies of turbulent flow. Reynolds called the two motions direct and sinuous. Today we call them laminar and turbulent.
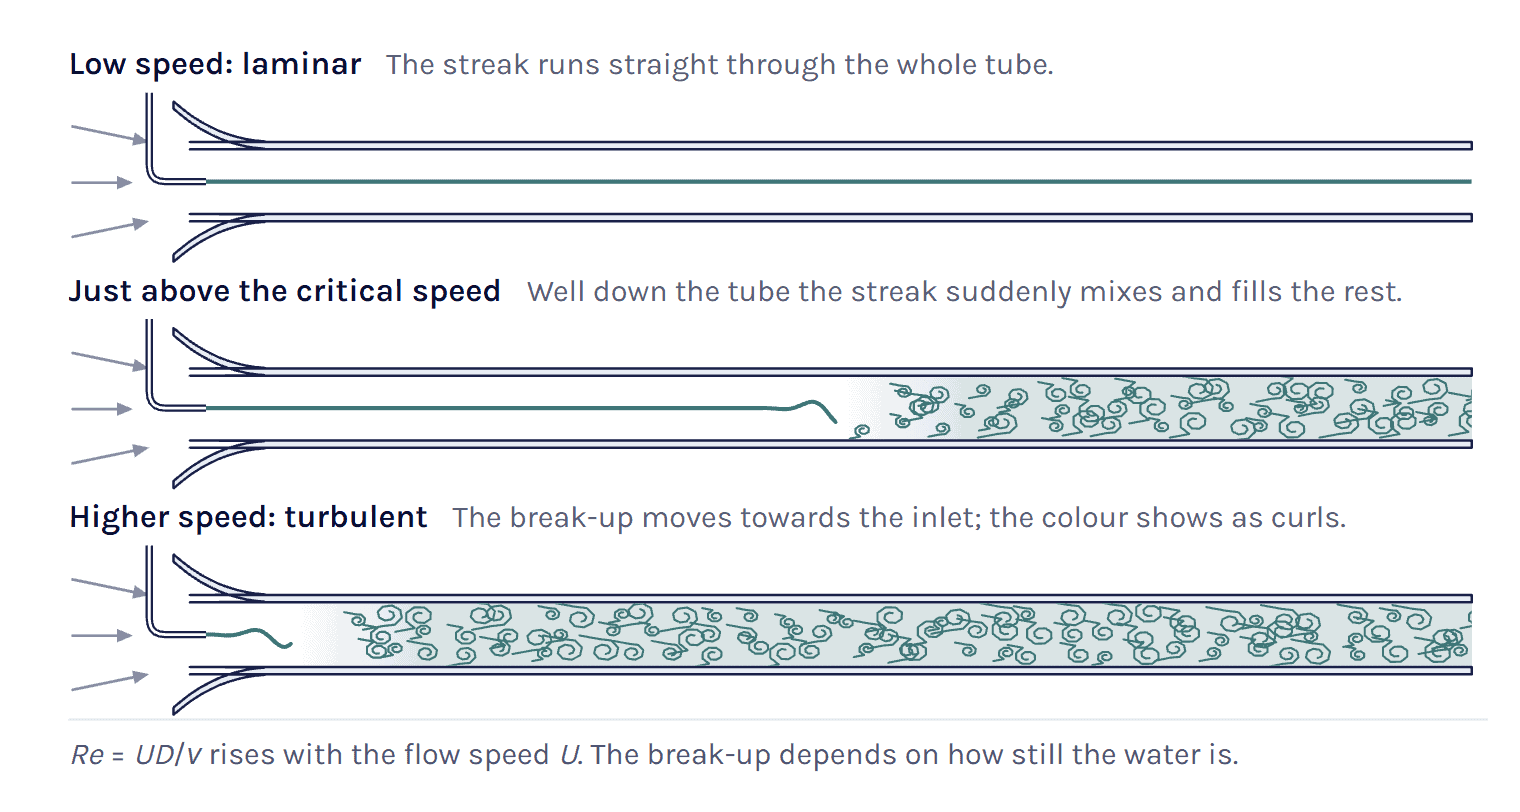
He also found that the speed at which the eddies appeared was inversely proportional to the tube diameter and fell as the water got warmer [14], in other words as its viscosity dropped. Both point to UD/ν, the ratio now called the Reynolds number [12]. The critical speed was also very sensitive to disturbances in the water before it entered the tubes [14]. So there is no one Reynolds number where every pipe flow turns turbulent. It depends on how disturbed the water is.
The calculator’s small-tube example shows the laminar case of Reynolds’ experiment, a straight dye thread, for water at 20 °C in a 4 mm tube at 0.3 m/s (Re ≈ 1200).
Flow regimes by geometry
The table gives the regimes for the four shapes in the calculator. Read the pipe rows with Re on D or Dh, the plate rows with Rex, and the cylinder and sphere rows with Re on the diameter. Where the sources spread, the second line in the first column says how far.
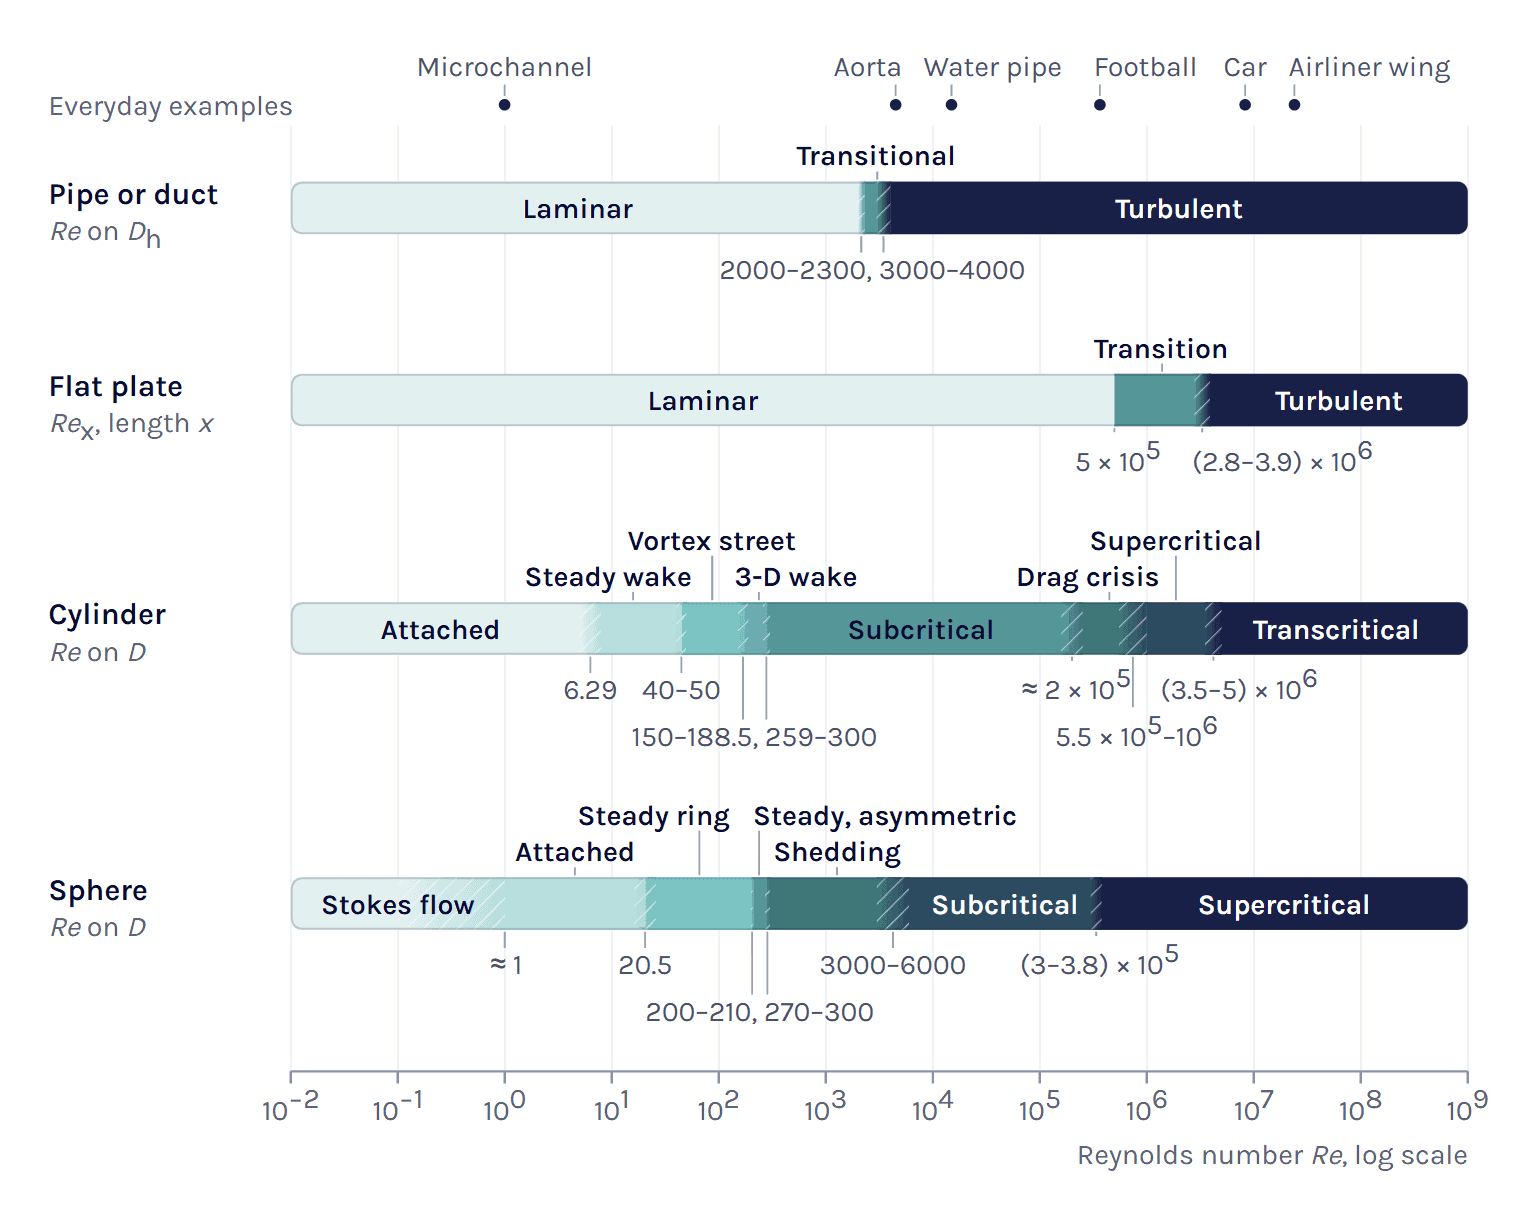
The same number means different things for different shapes. At Re = 5 × 10⁵ a pipe flow is far into the turbulent range, while on a flat plate this is the engineering critical value of Rex, where the boundary layer goes from most likely laminar to most likely turbulent [15]. A smooth cylinder is past its critical Reynolds number of about 2 × 10⁵ [18], and a smooth sphere is past the 3.7 × 10⁵ that Achenbach measured [29].
Critical Reynolds number
Reynolds also found a second, lower critical speed in a pipe, at which eddies that are already there die out along the pipe [14], and the critical value he estimated is about 2000 [10]. Avila et al. later pinned down where turbulence becomes sustained, at Re = 2040 ± 10. Below it a turbulent puff is more likely to decay than to split, and above it the puffs split and spread [10, 11]. Mukund and Hof put the critical point between 2020 and 2060, and between about 1700 and 2300 they found turbulence only as such local puffs, with fully turbulent flow collapsing into them [12].
Above that, the Reynolds number alone does not decide. Reynolds found that with enough care in setting up the pipe, turbulence could be put off to about 13 000 [12], and laminar pipe flow is linearly stable to at least Re = 10⁷ [10]. Without that care it turns turbulent much earlier. Even in Mukund and Hof’s 4 mm research pipe natural transition came at about 3000 [12], and a university physics textbook gives turbulent flow above about 3000 [13]. The calculator draws its transitional band from 2300 to about 4000, a round upper limit with some margin above 3000. Treat that band as a warning in a real system with bends and valves upstream, where both kinds of flow are possible.
On a flat plate with no pressure gradient, the engineering critical value is Rex,cr = 5 × 10⁵ [15]. Where transition really starts depends on how quiet the free stream is. Schubauer and Skramstad brought the turbulence in their wind tunnel below about 0.1 %, and transition then began at Rex ≈ 2.8 × 10⁶ and ended at about 3.9 × 10⁶. At 0.34 % it began near 1.5 × 10⁶ [16]. More turbulence in the free stream brings it earlier still. The calculator therefore draws the plate band from 5 × 10⁵ to 3.9 × 10⁶.
Critical means something else for a cylinder or a sphere, where it marks the drag crisis. On a cylinder the laminar boundary layer separates, turns turbulent and reattaches, so the final separation moves aft and the drag drops [20, 21]. Roshko gives about 2 × 10⁵ for the cylinder [18], and for a smooth sphere Achenbach found an upper critical value of 3.7 × 10⁵, above which he could no longer detect periodic shedding [29]. Neither is a fixed number. Achenbach’s drag measurements on spheres were made at about 0.45 % free-stream turbulence [31], and roughness moves the crisis to a lower Reynolds number, as the drag coefficient calculator page shows for golf balls.
Pipes and ducts
Hydraulic diameter
For a duct that is not round, Re uses the hydraulic diameter, with A the cross-section area and P the wetted perimeter, the length of wall in contact with the fluid.
Dh = 4A / P (2)
A round pipe gives Dh = D, and a rectangle a × b gives 2ab/(a + b). A concentric annulus gives Do − Di and two wide parallel plates with a gap h give 2h. The free surface of a part-full pipe or an open channel is not wetted, so it stays out of P. Note that hydraulics texts often use the hydraulic radius Rh = A/P = Dh/4 instead, and a Reynolds number on Rh is 4 times smaller for the same flow.
The hydraulic diameter is a convenient length, not an exact equivalence. Fully developed laminar flow in a round pipe has a Darcy friction factor f = 64/Re [10], but with Dh the exact laminar solution gives f·Re = 56.9 for a square duct and 96 between parallel plates (our calculation), about 11 % below and 50 % above 64/Re.
Reynolds number from a flow rate
When you know the flow rate rather than the speed, the mean speed is U = Q/A for a volume flow Q, or U = ṁ/(ρA) for a mass flow ṁ, and Re follows from (1). For a round pipe the area drops out.
Re = 4ṁ / (πDμ) = 4Q / (πDν) (3)
The mass-flow form needs only μ, not the density. Take the same 25 mm water pipe at 0.5 kg/s. Then Re = 4 × 0.5 / (π × 0.025 × 1.0016 × 10⁻³) = 2.54 × 10⁴, and the mean speed is 0.5 / (998.2 × 4.909 × 10⁻⁴) = 1.02 m/s. For a duct of any other shape, use the real cross-section area for A and Dh only as the length. The HVAC example below shows what goes wrong otherwise.
Flat plate and the transition point
Along a flat plate the boundary layer starts laminar at the leading edge and grows with the distance x, and so does the local Reynolds number Rex = Ux/ν [15]. With the engineering critical value of 5 × 10⁵, transition is expected to start at
xcr = Rex,cr ν / U (4)
In air at 20 °C and 20 m/s this gives xcr = 5 × 10⁵ × 1.506 × 10⁻⁵ / 20 = 0.38 m. The 3.5 m plate of the example has ReL = 4.65 × 10⁶, and transition is expected from about 0.38 m, so roughly the first 11 % of the plate is laminar. A very quiet stream could delay it to Rex ≈ 2.8 × 10⁶, 2.1 m from the leading edge, with the layer turbulent by about 2.9 m [16], and a turbulent free stream brings it forward.
Load the plate example in the calculator ↑
The same numbers tell you whether a CFD model of the plate can be fully turbulent from the leading edge or whether a transition model is worth the extra cost (see the Simcenter STAR-CCM+ section).
Cylinder and sphere
Behind a circular cylinder the wake changes several times as Re rises. Sen et al. computed that the flow first separates at Re = 6.29 [17], and up to about 40 two steady eddies sit behind the cylinder. Roshko measured regular vortex streets from about 40 to 150, a transition range from 150 to 300 and an irregular range above 300, where turbulence comes with the shedding [18]. Barkley and Henderson found that the two-dimensional street turns three-dimensional at Re = 188.5 [19], and a 2D simulation cannot follow that.
Periodic shedding has been seen up to about 2 × 10⁵ [18], and Bearman still found narrow-band shedding at 5.5 × 10⁵, well into the critical range [22]. Achenbach describes the drag crisis in three states, from laminar separation (subcritical) through a separation bubble with turbulent reattachment (critical) to a boundary layer that turns turbulent before it separates (supercritical) [20]. Above 3.5 × 10⁶ Roshko found the drag coefficient back at 0.7 and regular shedding again [23], and Schewe puts the start of this transcritical range at about 5 × 10⁶ [21].
The shedding frequency follows from the Strouhal number, St = fD/U, and Roshko found St essentially constant, at about 0.21, in the irregular range that he measured up to Re = 10⁴ [18].
Dennis and Walker computed that flow past a sphere first separates at Re = 20.5 [26]. Johnson and Patel found a steady, axisymmetric wake up to Re = 200, a steady but non-axisymmetric wake from 210 to 270 and periodic shedding above 270 [27]. Achenbach saw strong periodic fluctuations in the wake from 6000 to 3 × 10⁵ and could no longer detect periodic shedding above 3.7 × 10⁵ [29], and Taneda saw the wake form a pair of streamwise vortices from 3.8 × 10⁵ [30].
The calculator’s football example, a 0.22 m ball at 25 m/s in air at 20 °C, has Re = 3.65 × 10⁵, just below that edge and inside the zone where these sources put the crisis. For the drag coefficient itself, use the drag coefficient calculator.
Worked examples
HVAC duct: hydraulic diameter and flow rate
A rectangular ventilation duct of 400 × 200 mm carries air at 20 °C and 1 atm at a mean speed of 5 m/s. The hydraulic diameter is Dh = 2 × 0.4 × 0.2 / (0.4 + 0.2) = 0.267 m, and Re = 5 × 0.267 / (1.506 × 10⁻⁵) = 8.85 × 10⁴. The flow is turbulent. Taking the width of 400 mm as the length would give 1.33 × 10⁵, 50 % too high.
The volume flow is Q = UA = 5 × 0.08 = 0.4 m³/s, or 1440 m³/h. If you start from that flow rate, divide it by the real area of 0.08 m². Dividing by the area of a circle with diameter Dh, π × 0.267²/4 = 0.0559 m², gives 7.16 m/s, 43 % too high, and Re comes out at 1.27 × 10⁵.
Load the duct example in the calculator ↑
Cable in wind: vortex shedding
A 20 mm cable in a 5 m/s wind at 20 °C has Re = 5 × 0.02 / (1.506 × 10⁻⁵) = 6640. That is in the subcritical range, where the wake is turbulent and still sheds vortices, and inside the range where Roshko found St ≈ 0.21 [18]. The shedding frequency is f = St·U/D ≈ 0.21 × 5 / 0.02 = 52.5 Hz, the number you compare with the natural frequencies of the cable and its supports. A laminar vortex street, Re from about 40 to 150, would need the wind to drop to 0.03 to 0.11 m/s.
Load the cable example in the calculator ↑
Model in a wind tunnel: matching the Reynolds number
Two geometrically similar flows with the same Reynolds number have the same balance between inertial and viscous forces [1], and that is why you test a scale model at the full-scale Re where you can. Take a car of 4.5 m at 100 km/h in air at 20 °C (example values, not a particular car). Its Reynolds number is Re = 27.8 × 4.5 / (1.506 × 10⁻⁵) = 8.30 × 10⁶, and a 1:4 model, 1.125 m long, needs four times the speed, 111 m/s or 400 km/h.
That is Mach 0.32, with a speed of sound of a = √(γRT) = 343 m/s at 20 °C and γ = 1.4 [37, 38]. The density at the nose is then about 5 % above the free stream in isentropic flow [37], and the model no longer matches the car on Mach number. Water at 20 °C, with a kinematic viscosity 15 times lower, lets the same model run at 7.40 m/s. The Match this Re button in the calculator does this in one step and warns about the Mach number.
Reynolds number in Simcenter STAR-CCM+
In Simcenter STAR-CCM+ the Reynolds number is the first thing to check before you choose the physics models, since the Viscous Regime group asks you to pick Inviscid, Laminar or Turbulent [39]. The S-bend tutorial in the documentation runs the same 2 cm pipe twice, laminar at Re = 500 and turbulent at Re = 50 000 [39]. Its material has a constant density of 1 kg/m³ and a dynamic viscosity of 1.716 × 10⁻⁵ Pa·s, and with an inlet velocity of 0.429 m/s that gives Re = 1 × 0.429 × 0.02 / (1.716 × 10⁻⁵) = 500.
Note that the density of 1 kg/m³ is a value chosen for the tutorial, not air. Real air at 20 °C at the same speed gives Re = 570, laminar as well. For Re = 50 000 the tutorial raises the speed to 42.9 m/s, and the turbulent part uses the Realizable K-Epsilon Two-Layer model with the Two-Layer All y+ Wall Treatment [39].
When Re falls in the transitional range of a pipe, we run the case both laminar and turbulent and compare, and treat the difference as part of the uncertainty.
Material properties
The fluid models in the calculator have counterparts with the same names in Simcenter STAR-CCM+. The equation of state models include Constant Density, Ideal Gas and IAPWS-IF97 (Water), and the Dynamic Viscosity methods include Constant and Sutherland’s Law. All of them except Constant Density and Constant need an Energy model in the continuum, and IAPWS-IF97 (Water) also needs a liquid material [39]. Sutherland’s Law has the same form as the law in the calculator. The calculator’s Simcenter STAR-CCM+ panel gives you Density and Dynamic Viscosity in kg/m^3 and Pa-s to copy for a constant-property case. If your properties depend on temperature, the documentation suggests checking that numbers such as Re and the Prandtl number keep the values you expect [39].
At very low pressure the calculator also checks the Knudsen number for air, Kn = (Ma/Re)√(γπ/2), the form the documentation gives for high Reynolds numbers. The documentation treats the flow as a continuum only below Kn = 0.01 [39].
Local Reynolds number as a field function
The field function library has Reynolds numbers for particles and phase pairs in multiphase models, and some that belong to turbulence and transition models, but none for the bulk flow [39]. So we write Re as a user field function. With the Density and DynamicViscosity field functions and a length typed in metres, here the 25 mm pipe, a local Re based on the speed in each cell is
This is our construction from the documented syntax, where $ marks a scalar and $$ a vector field function [39]. Replace 0.025 with your own length.
Transition models
If your Re puts a boundary layer in a transition band, a flat plate past Rex = 5 × 10⁵ for example, a transition model predicts where it turns turbulent instead of assuming it is turbulent everywhere. Gamma ReTheta and Gamma work with SST (Menter) K-Omega, and SA Gamma with Standard Spalart-Allmaras [39]. The transition guidelines ask for a wall y+ between 0.1 and 1 and, for natural and low free-stream bypass transition, a free-stream turbulent viscosity ratio between 1 and 10 [39]. You can size the first cell with the y+ calculator and the inlet with the turbulence boundary conditions calculator. Our blog post Transition modelling in Simcenter STAR-CCM+ collects more on these models.
If you are not sure which of laminar, turbulent or a transition model your case needs, the turbulence model selector is one place to start. You can also use the form below and choose Technical question.
References and changelog
References
[1] NASA Glenn Research Center, Reynolds number, Beginner’s Guide to Aeronautics. https://www.grc.nasa.gov/www/k-12/airplane/reynolds.html
[2] A. Thompson and B. N. Taylor, Guide for the Use of the International System of Units (SI), NIST Special Publication 811, 2008 edition, Appendix B.8.
[3] IAPWS R12-08, Release on the IAPWS Formulation 2008 for the Viscosity of Ordinary Water Substance, 2008.
[4] IAPWS R7-97(2012), Revised Release on the IAPWS Industrial Formulation 1997 for the Thermodynamic Properties of Water and Steam.
[5] E. W. Lemmon, R. T Jacobsen, S. G. Penoncello and D. G. Friend, Thermodynamic properties of air and mixtures of nitrogen, argon, and oxygen from 60 to 2000 K at pressures to 2000 MPa, Journal of Physical and Chemical Reference Data 29(3), 331–385, 2000.
[6] U.S. Standard Atmosphere, 1976, NOAA, NASA and USAF, NASA-TM-X-74335 (Sutherland constant S = 110.4 K).
[7] E. W. Lemmon and R. T Jacobsen, Viscosity and thermal conductivity equations for nitrogen, oxygen, argon, and air, International Journal of Thermophysics 25(1), 21–69, 2004.
[8] Y. A. Çengel and J. M. Cimbala, Fluid Mechanics: Fundamentals and Applications, 3rd ed., McGraw-Hill, 2014, Tables A-3 and A-9.
[9] ITTC Recommended Procedures and Guidelines 7.5-02-01-03, Fresh water and seawater properties, International Towing Tank Conference, 2011.
[10] D. Barkley, Theoretical perspective on the route to turbulence in a pipe, Journal of Fluid Mechanics 803, P1, 2016. https://doi.org/10.1017/jfm.2016.465
[11] K. Avila, D. Moxey, A. de Lozar, M. Avila, D. Barkley and B. Hof, The onset of turbulence in pipe flow, Science 333, 192–196, 2011. https://doi.org/10.1126/science.1203223
[12] V. Mukund and B. Hof, The critical point of the transition to turbulence in pipe flow, Journal of Fluid Mechanics 839, 76–94, 2018. https://doi.org/10.1017/jfm.2018.31
[13] W. Moebs, S. J. Ling and J. Sanny, University Physics Volume 1, OpenStax, Rice University, 2016, section 14.7 Viscosity and turbulence. https://openstax.org/books/university-physics-volume-1/pages/14-7-viscosity-and-turbulence
[14] O. Reynolds, An experimental investigation of the circumstances which determine whether the motion of water shall be direct or sinuous, and of the law of resistance in parallel channels, Philosophical Transactions of the Royal Society of London 174, 935–982, 1883. https://doi.org/10.1098/rstl.1883.0029
[15] J. M. Cimbala, Turbulent flat plate boundary layer, ME 320 lesson notes 13D, Penn State University (figures and tables from Y. A. Çengel and J. M. Cimbala, Fluid Mechanics, 4th ed.). https://me.psu.edu/cimbala/me320/Lesson_Notes/Fluid_Mechanics_Lesson_13D.pdf
[16] G. B. Schubauer and H. K. Skramstad, Laminar-boundary-layer oscillations and transition on a flat plate, NACA Report 909, 1948 (also Journal of Research of the National Bureau of Standards 38, 251–292, 1947), figure 7. https://ntrs.nasa.gov/citations/19930091976
[17] S. Sen, S. Mittal and G. Biswas, Steady separated flow past a circular cylinder at low Reynolds numbers, Journal of Fluid Mechanics 620, 89–119, 2009. https://doi.org/10.1017/S0022112008004904
[18] A. Roshko, On the development of turbulent wakes from vortex streets, NACA Report 1191, 1954. https://ntrs.nasa.gov/citations/19930092207
[19] D. Barkley and R. D. Henderson, Three-dimensional Floquet stability analysis of the wake of a circular cylinder, Journal of Fluid Mechanics 322, 215–241, 1996. https://doi.org/10.1017/S0022112096002777
[20] E. Achenbach, Distribution of local pressure and skin friction around a circular cylinder in cross-flow up to Re = 5 × 10⁶, Journal of Fluid Mechanics 34, 625–639, 1968. https://doi.org/10.1017/S0022112068002120
[21] G. Schewe, On the force fluctuations acting on a circular cylinder in crossflow from subcritical up to transcritical Reynolds numbers, Journal of Fluid Mechanics 133, 265–285, 1983. https://doi.org/10.1017/S0022112083001913
[22] P. W. Bearman, On vortex shedding from a circular cylinder in the critical Reynolds number régime, Journal of Fluid Mechanics 37, 577–585, 1969. https://doi.org/10.1017/S0022112069000735
[23] A. Roshko, Experiments on the flow past a circular cylinder at very high Reynolds number, Journal of Fluid Mechanics 10, 345–356, 1961. https://doi.org/10.1017/S0022112061000950
[24] E. Achenbach and E. Heinecke, On vortex shedding from smooth and rough cylinders in the range of Reynolds numbers 6 × 10³ to 5 × 10⁶, Journal of Fluid Mechanics 109, 239–251, 1981. https://doi.org/10.1017/S002211208100102X
[25] I. Proudman and J. R. A. Pearson, Expansions at small Reynolds numbers for the flow past a sphere and a circular cylinder, Journal of Fluid Mechanics 2, 237–262, 1957. https://doi.org/10.1017/S0022112057000105
[26] S. C. R. Dennis and J. D. A. Walker, Calculation of the steady flow past a sphere at low and moderate Reynolds numbers, Journal of Fluid Mechanics 48, 771–789, 1971. https://doi.org/10.1017/S0022112071001848
[27] T. A. Johnson and V. C. Patel, Flow past a sphere up to a Reynolds number of 300, Journal of Fluid Mechanics 378, 19–70, 1999. https://doi.org/10.1017/S0022112098003206
[28] R. Natarajan and A. Acrivos, The instability of the steady flow past spheres and disks, Journal of Fluid Mechanics 254, 323–344, 1993. https://doi.org/10.1017/S0022112093002150
[29] E. Achenbach, Vortex shedding from spheres, Journal of Fluid Mechanics 62, 209–221, 1974. https://doi.org/10.1017/S0022112074000644
[30] S. Taneda, Visual observations of the flow past a sphere at Reynolds numbers between 10⁴ and 10⁶, Journal of Fluid Mechanics 85, 187–192, 1978. https://doi.org/10.1017/S0022112078000580
[31] E. Achenbach, Experiments on the flow past spheres at very high Reynolds numbers, Journal of Fluid Mechanics 54, 565–575, 1972. https://doi.org/10.1017/S0022112072000874
[32] A. F. Stalder, A. Frydrychowicz, M. F. Russe, J. G. Korvink, J. Hennig, K. Li and M. Markl, Assessment of flow instabilities in the healthy aorta using flow-sensitive MRI, Journal of Magnetic Resonance Imaging 33, 839–846, 2011. https://doi.org/10.1002/jmri.22512
[33] E. Lauga and T. R. Powers, The hydrodynamics of swimming microorganisms, Reports on Progress in Physics 72, 096601, 2009. https://doi.org/10.1088/0034-4885/72/9/096601
[34] F. Durst, S. Ray, B. Ünsal and O. A. Bayoumi, The development lengths of laminar pipe and channel flows, Journal of Fluids Engineering 127, 1154–1160, 2005. https://doi.org/10.1115/1.2063088
[35] A. R. Barbin and J. B. Jones, Turbulent flow in the inlet region of a smooth pipe, Journal of Basic Engineering 85, 29–33, 1963. https://doi.org/10.1115/1.3656521
[36] H. Schlichting, Lecture series “Boundary layer theory”, Part I Laminar flows and Part II Turbulent flows, NACA TM 1217 and TM 1218, 1949. https://ntrs.nasa.gov/citations/20040021320
[37] Ames Research Staff, Equations, tables, and charts for compressible flow, NACA Report 1135, 1953, equation 45.
[38] NASA Glenn Research Center, Isentropic flow equations, Beginner’s Guide to Aeronautics. https://www.grc.nasa.gov/www/k-12/airplane/isentrop.html
[39] Simcenter STAR-CCM+ documentation, version 2606, Siemens Digital Industries Software, 2026 (tutorial Laminar and Turbulent Flow in an S-Bend, the Viscous Regime, Equation of State and Gamma transition model references, the Field Function Library, User Field Function Examples, Transition Guidelines, Flow Regimes, and Guidelines for Fluid Flow and Energy).
Changelog
October 2026: first published, with the calculator, the regime map and this guide. The fluid properties and regime limits were checked against the sources listed above, apart from the two band edges given as “about” in the table.
Questions about the Reynolds number
Ask a Volupe specialist
Christoffer Johansson
Senior Application Specialist, M.Sc.
Questions about laminar, turbulent or transition set-ups? We reply within one day.
Ask a technical question →
At what Reynolds number is flow laminar or turbulent?
It depends on the shape. Pipe flow is laminar below about 2000 and turbulent above about 3000, with either possible in between, and the calculator draws its transitional band from 2300 to 4000. On a flat plate the engineering value is Reₓ = 5 × 10⁵, though transition can wait until about 2.8 × 10⁶ in a very quiet stream. A cylinder or a sphere has no single value. Its wake changes step by step, up to the drag crisis at about 2 × 10⁵ for a cylinder and 3.7 × 10⁵ for a smooth sphere.
What does a Reynolds number of 500,000 mean?
It depends on the shape the number belongs to. Pipe flow at Re = 5 × 10⁵ is far into the turbulent range. On a flat plate the same number is the engineering critical value of the local Reynolds number Reₓ, below which the boundary layer is most likely laminar and above which it is most likely turbulent. A smooth cylinder is past its critical Reynolds number of about 2 × 10⁵, in the drag crisis, and a smooth sphere is past the upper critical value of 3.7 × 10⁵ that Achenbach measured.
What if the Reynolds number is between 2000 and 3000?
That is the range where pipe flow can be either. Below about 2000 turbulence dies out on its own, and Avila et al. put the point where it becomes sustained at Re = 2040 ± 10. Up to about 2300 turbulence comes only as local puffs that travel with the flow, and above that it can spread. Whether a given pipe is then laminar or turbulent depends on how disturbed the inlet is, and in a carefully built rig Mukund and Hof saw natural transition at about 3000. In CFD we run such a case both laminar and turbulent and compare.
What is the critical Reynolds number for a flat plate?
The engineering value is Reₓ = 5 × 10⁵, with x measured from the leading edge. Below it the boundary layer is most likely laminar and above it most likely turbulent. Transition is then expected from x = 5 × 10⁵ ν/U, 0.38 m in air at 20 °C and 20 m/s. Where it really starts depends on how quiet the free stream is. In a wind tunnel with less than about 0.1 % turbulence, Schubauer and Skramstad saw transition begin only at about 2.8 × 10⁶.
How do I find the Reynolds number from a mass flow rate?
Divide the mass flow by the density and the cross-section area to get the mean speed, U = ṁ/(ρA), and use it in Re = ρUD/μ. In a round pipe this becomes Re = 4ṁ/(πDμ), which needs only the dynamic viscosity. Water at 20 °C flowing at 0.5 kg/s in a 25 mm pipe gives Re = 4 × 0.5/(π × 0.025 × 1.0016 × 10⁻³) = 2.54 × 10⁴. For a duct of another shape, use Re = ṁDₕ/(Aμ), with the real area A and the hydraulic diameter Dₕ.
Does the Reynolds number have units?
No. In Re = ρUL/μ the numerator has the units kg/m³ × m/s × m and the denominator Pa·s, which is kg/(m·s), so the units cancel and leave a pure number. The value is the same in SI and US units as long as every input is converted consistently, for example with the kinematic viscosity in m²/s and not in cSt.
What is the difference between dynamic and kinematic viscosity?
The dynamic viscosity μ (Pa·s, or cP = mPa·s) relates the shear stress in the fluid to the velocity gradient. The kinematic viscosity ν (m²/s, or cSt = mm²/s) is the dynamic viscosity divided by the density, ν = μ/ρ. Water at 20 °C has μ = 1.002 mPa·s and ν = 1.003 mm²/s. Air at 20 °C has a dynamic viscosity 55 times lower than water but a kinematic viscosity 15 times higher, and at the same speed and size you get a Reynolds number 15 times lower in air.
Which length should I use in the Reynolds number?
The one the regime limits you compare with are based on. That is the inner diameter for a round pipe, the hydraulic diameter Dₕ = 4A/P for any other duct, the distance from the leading edge for a flat plate, and the diameter for a cylinder or a sphere. Hydraulics texts sometimes use the hydraulic radius, a quarter of Dₕ, which gives a Reynolds number 4 times smaller.
Can Volupe help me choose laminar, turbulent or transition physics in Simcenter STAR-CCM+?
Yes. Our application engineers help Simcenter STAR-CCM+ users with set-ups like these, from the material properties and the Viscous Regime to transition models and the mesh near the wall. Customers with maintenance get this through our support, and we also run Simcenter STAR-CCM+ training courses.