Air and water properties calculator
Density, viscosity, specific heat and conductivity of air or water at the temperature and pressure you enter.
Calculator
Density of air
At 20 °C and 101.325 kPa (1 atm), dry air has a density of 1.204 kg/m³, which is 0.07518 lb/ft³, and at 15 °C and 1 atm its density is 1.225 kg/m³ [1].
Near atmospheric pressure, air behaves almost as an ideal gas, and you can work out the density from the absolute pressure p and the absolute temperature T in kelvin:
ρ = p/(RT) (1)
Here R is the specific gas constant of dry air, 8.31451 J/(mol·K) / 0.0289586 kg/mol = 287.117 J/(kg·K), from the gas constant and the molar mass that Lemmon et al. use [1]. At 20 °C that gives 101 325 Pa / (287.117 × 293.15 K) = 1.204 kg/m³. You need not stop at (1): the tool solves the full equation of state for air, which also holds at high pressures and low temperatures where air is no longer ideal [1]. At 1 atm the two agree within 0.19 % over the whole temperature range, but at 10 MPa and −50 °C the ideal gas gives a density 11 % too low.
The density falls as the air warms and rises with the pressure. At 1 atm dry air has 1.293 kg/m³ at 0 °C, 1.127 kg/m³ at 40 °C and 0.9456 kg/m³ at 100 °C, and at 20 °C and 1 MPa, about ten times atmospheric pressure, it has 11.92 kg/m³. The table for air further down lists it from −20 to 200 °C at 1 atm. For any other temperature and pressure in the calculator’s range, −60 to 1000 °C and 1 kPa to 10 MPa, use it as an air density calculator, for dry air or, up to 100 °C, humid air.
Load the US units example (lb/ft³) ↑
Humid air
Humid air is a little lighter than dry air at the same temperature and pressure. At 20 °C and 1 atm, 50 % relative humidity lowers the density by 0.44 %, from 1.204 to 1.199 kg/m³, and saturated air at 20 °C is 0.87 % lighter than dry air [2].
The reason is the molar mass. Water vapour has 18.015 g/mol against 28.965 g/mol for dry air, and in the CIPM-2007 formula the vapour mole fraction xv enters as the factor 1 − xv(1 − Mv/Ma) [2]. Warmer air holds more vapour at saturation, so the effect grows: at 30 and 40 °C, beyond the range the formula is stated for, saturated air comes out 1.6 % and 2.7 % lighter.
If you enter a relative humidity, the dry-air density is multiplied by the ratio of moist-air to dry-air density from CIPM-2007, the revised formula for the density of moist air of Picard et al. [2]. At 0 % you get the dry-air value exactly. The formula is stated for 15 to 27 °C and 600 to 1100 hPa [2], and outside that window you still get a value, with a flag. Humidity is covered from 0 to 100 °C: below 0 °C it is not used, because the formula has no vapour pressure over ice, and above 100 °C you are asked to set it to 0.
Note that humidity changes only the density, and through it the kinematic viscosity, which is the dry-air viscosity divided by the humid density. The viscosity, specific heat, conductivity and Prandtl number stay dry-air values. By ideal-gas mixing, air at 20 °C and 50 % RH would have a cp about 0.6 % higher than dry air, which the tool leaves out. With much vapour in the gas the dry-air values can be far off: for saturated air at 80 °C and 1 atm the same mixing gives a cp about 31 % higher. So wherever water vapour is more than a tenth of the gas, the tool warns you and hatches the μ, ν, cp, k and Pr curves.
Density of water
Liquid water at 20 °C and 1 atm has a density of 998.21 kg/m³, which is 0.99821 g/cm³ or 62.316 lb/ft³ [3].
It is densest at 3.98 °C, where it reaches 999.97 kg/m³ (62.426 lb/ft³). Below that temperature the density falls again, to 999.84 kg/m³ at 0 °C. Above it, the density falls with temperature, to 992.22 kg/m³ at 40 °C and 958.35 kg/m³ at 100 °C. A round 1000 kg/m³ is 0.18 % high at 20 °C and 4.3 % high at 100 °C.
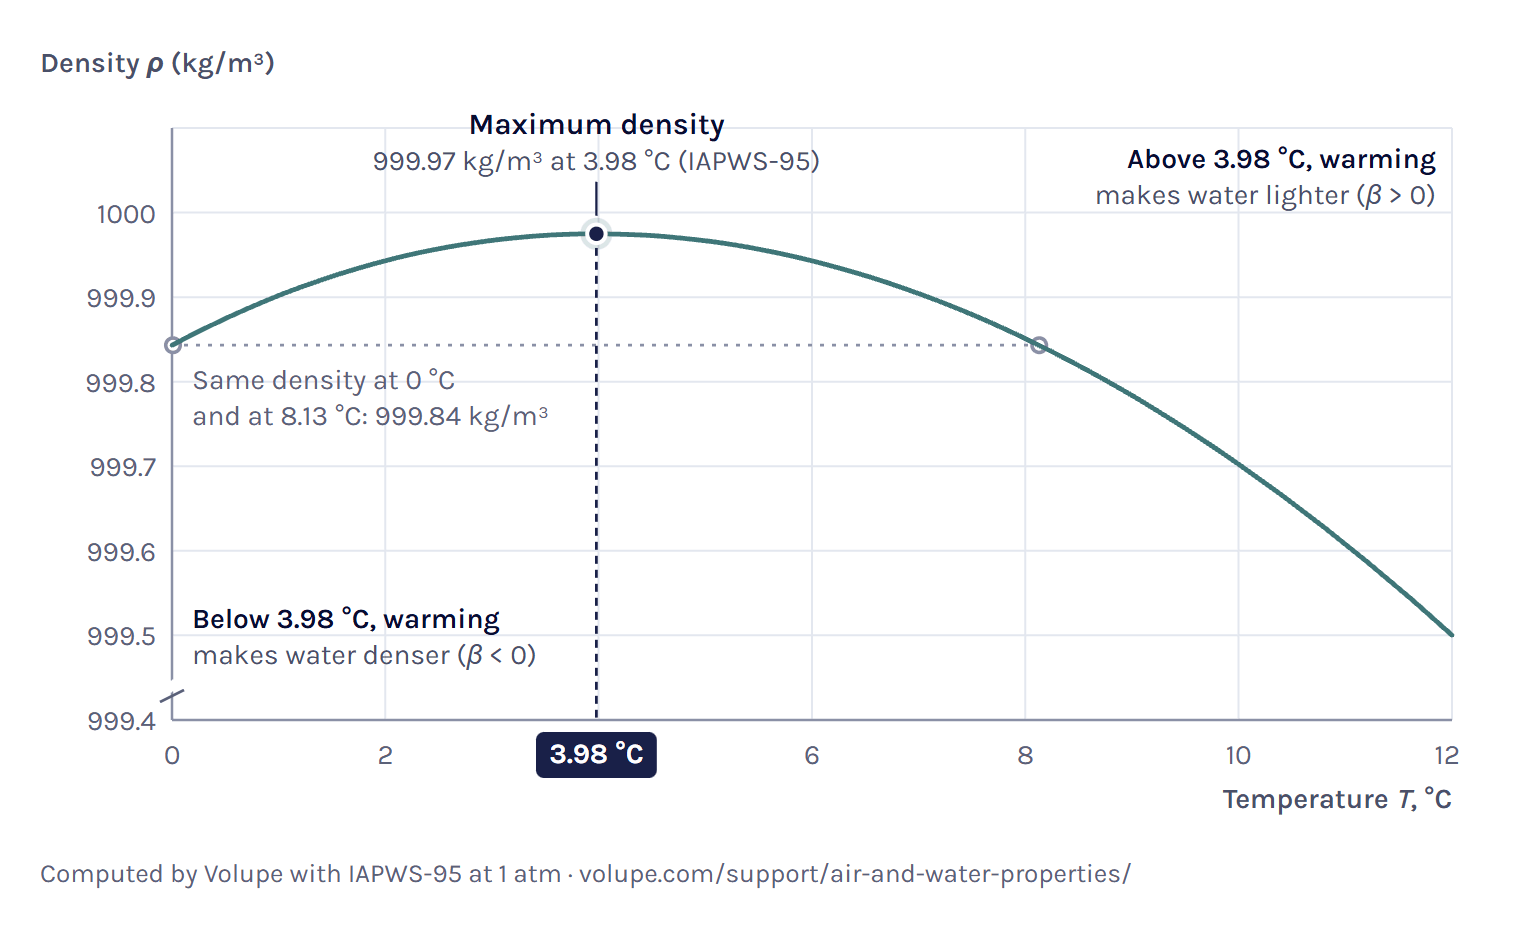
Water is hard to compress. At 20 °C, going from 1 atm to 10 MPa, about a hundred atmospheres, raises the density by only 0.45 %, to 1002.7 kg/m³. Pressure matters more for where the liquid ends: at 1 atm water boils at 99.97 °C, and at 5 bar it stays liquid up to 151.84 °C [4].
Viscosity of air
Dry air at room temperature, 20 °C and 1 atm, has a dynamic viscosity of 1.821 × 10⁻⁵ Pa·s (18.21 µPa·s) and a kinematic viscosity of 1.512 × 10⁻⁵ m²/s (15.12 mm²/s) [5].
A gas gets more viscous when it is heated, while a liquid gets less viscous [6]. Air at atmospheric pressure is what Lemmon and Jacobsen call a dilute gas, and for it they use the Chapman–Enskog theory with a collision integral fitted to measurements. In that theory the viscosity μ0 is proportional to √T divided by the collision integral Ω(T*), with T* = T/103.3 K for air, and Ω gets smaller as the gas warms, so both make the viscosity rise with temperature [5]. At 20 °C and 1 atm this dilute-gas term is 99.9 % of the viscosity.
Over a wide range the effect is large: the dynamic viscosity goes from 14.61 µPa·s at −50 °C to 21.90 µPa·s at 100 °C and 50.63 µPa·s at 1000 °C, all at 1 atm.
Dynamic viscosity of air
The dynamic viscosity μ of dry air at 1 atm is 17.22 µPa·s at 0 °C, 18.21 µPa·s at 20 °C and 21.90 µPa·s at 100 °C [5]. Pressure hardly changes it near atmospheric pressure. At 20 °C, going to 1 MPa raises it by 0.8 %.
Kinematic viscosity of air
The kinematic viscosity of air is 15.12 mm²/s at 20 °C and 1 atm. If you take ν = μ/ρ from a table, the density is already in it, and because the density falls as the air warms, ν rises faster than μ: from 0 to 100 °C, μ goes up by 27 % and ν by 74 %, from 13.32 to 23.16 mm²/s.
Pressure works the other way. The density rises almost in proportion to the pressure while μ stays nearly the same, so ν falls almost in inverse proportion: at 20 °C and 1 MPa it is 1.539 mm²/s, about a tenth of the value at 1 atm. When you take ν for air from a table, check which pressure the table is for.
Viscosity of water
Water at 20 °C and 1 atm has a dynamic viscosity of 1.0016 mPa·s, which is 1.0016 cP or 0.0010016 Pa·s [7].
In a liquid the molecules are held together by the forces between them, and as the liquid warms they move faster and are better able to overcome those forces, so the viscosity falls [8]. For water it falls steeply: from 1.7918 mPa·s at 0 °C to 0.5465 mPa·s at 50 °C and 0.2816 mPa·s at 100 °C, a factor of 6.4 over the liquid range at 1 atm. Between 20 and 25 °C alone it drops by 11 %, so a water temperature a few degrees off shows up directly in your Reynolds number.
The IAPWS 2008 formulation used here reproduces the ISO recommended value at 20 °C, 1.0016 mPa·s, within the digits given there [7].
Load the water at 25 °C example ↑
Kinematic viscosity of water
The kinematic viscosity of water is 1.0034 mm²/s (1.0034 × 10⁻⁶ m²/s) at 20 °C and 0.8927 mm²/s at 25 °C, both at 1 atm. Since the density of water is close to 1000 kg/m³, ν in mm²/s is close to μ in mPa·s: 1.0034 against 1.0016 at 20 °C, and 0.2938 against 0.2816 at 100 °C.
Dynamic and kinematic viscosity
Dynamic viscosity μ is the coefficient that links the shear stress τ in a fluid to the velocity gradient du/dy across the flow, τ = μ du/dy [9]. Its unit is the Pa·s [10]. The textbook picture is two plates: the force F needed to slide a plate of area A at speed v over a layer of fluid of thickness L is F = μvA/L, so μ is the shear stress F/A divided by the velocity gradient v/L [10].
Kinematic viscosity ν is the dynamic viscosity divided by the density, ν = μ/ρ, in m²/s [6, 9].
Both describe the molecular viscosity of the fluid at its temperature and pressure. That sets them apart from the turbulent viscosity a turbulence model adds. The centipoise and the centistokes are the same sizes as mPa·s and mm²/s: 1 mPa·s = 1 cP = 10⁻³ Pa·s, and 1 mm²/s = 1 cSt = 10⁻⁶ m²/s [11].
For water at 20 °C, ν = 1.0016 mPa·s / 998.21 kg/m³ = 1.0034 mm²/s. For air at 20 °C, ν = 18.21 µPa·s / 1.204 kg/m³ = 15.12 mm²/s. So water’s dynamic viscosity is about 55 times that of air, but air’s kinematic viscosity is about 15 times that of water.
Which one you need depends on the formula. The Reynolds number takes ρ and μ together, or ν alone, and a Nusselt correlation takes μ through the Reynolds and Prandtl numbers. You get both above, and the strip under the result compares water with air at the same state.
Specific heat of air
The specific heat capacity of dry air at constant pressure is 1006 J/(kg·K), or 1.006 kJ/(kg·K), at 20 °C and 1 atm [1].
It hardly changes near room temperature: from −50 to 100 °C at 1 atm it stays within 0.6 % of that value. Above that it rises, to 1025 J/(kg·K) at 200 °C and 1185 J/(kg·K) at 1000 °C. Pressure raises it too, to 1021 J/(kg·K) at 20 °C and 1 MPa.
At constant volume the specific heat is lower: cv = 717.8 J/(kg·K) at 20 °C and 1 atm, so the ratio of specific heats is γ = cp/cv = 1.402, from the same equation of state [1].
Between 0 and 40 °C, cp changes by 0.12 % and the density by 13 %. If buoyancy matters in your model, it is that change in density that drives the flow, as the section on CFD models below explains.
Specific heat of water
It takes 4184 J to warm a kilogram of liquid water by one kelvin at 20 °C and 1 atm: its specific heat capacity is 4.184 kJ/(kg·K), about 4.2 times that of air [3].
Over the liquid range at 1 atm it is nearly constant. It falls from 4.219 kJ/(kg·K) at 0 °C to a shallow minimum of 4.179 kJ/(kg·K) near 36 °C, then rises again to 4.216 kJ/(kg·K) at 100 °C, and between 30 and 45 °C it changes by less than 0.03 %.
Per cubic metre the gap between the two fluids is much larger. ρcp is 4.177 MJ/(m³·K) for water and 1.212 kJ/(m³·K) for air at 20 °C. Warming a cubic metre of water by one kelvin takes about 3400 times as much heat as warming a cubic metre of air.
Thermal conductivity of air and water
The thermal conductivity of dry air at 20 °C and 1 atm is 0.02587 W/(m·K) (25.87 mW/(m·K)) [5], and the thermal conductivity of water is 0.5980 W/(m·K) [12], about 23 times higher.
Both rise with temperature at 1 atm: air from 24.36 mW/(m·K) at 0 °C to 31.62 mW/(m·K) at 100 °C, and water from 0.5556 W/(m·K) to 0.6772 W/(m·K) over the same range.
Tables do not all agree on the conductivity of air. The air table in Çengel and Cimbala’s textbook gives 0.02514 W/(m·K) at 20 °C [13], 2.8 % below the Lemmon and Jacobsen value used here, while its density at 20 °C agrees with ours within 0.03 %. Lemmon and Jacobsen give their conductivity with about 2 % uncertainty in the dilute gas [5].
Prandtl number of air and water
The Prandtl number of dry air at 20 °C and 1 atm is 0.7081, and that of liquid water 7.008, about ten times higher. You get it from the three values above:
Pr = cpμ/k (2)
For air it stays between about 0.70 and 0.72 from −50 to 400 °C at 1 atm. For water it falls from 13.61 at 0 °C to 1.753 at 100 °C, mostly because the viscosity falls while cp and k change much less. Our page on dimensionless numbers explains what the Prandtl number means and where it comes in.
Property tables for air and water
The values below are for 101.325 kPa (1 atm). You get the same numbers from the tool above at each of these temperatures, because both use the same equations and the same rounding. For another pressure or range, the CSV download under the result gives you the same properties in SI, with β in place of the Prandtl number.
Air at 1 atm
Liquid water at 1 atm
Download the tables as CSV
You can also download the data of both tables as free CSV files. They come from the tool’s equations and rounding and have the headings of its CSV download, which the CFD section explains. Every column is in coherent SI units, with T in kelvin. The files have finer steps, and the air file covers a wider range. Water stops at 99 °C, below boiling at 1 atm.
How the values are calculated
Each property comes from a published formulation, and all of them except CIPM-2007 come with check values: for water the releases of the International Association for the Properties of Water and Steam (IAPWS), and for air the equations of Lemmon and his co-authors. These are the ones used here:
The kinematic viscosity is μ/ρ and the Prandtl number cpμ/k, as in (2). The thermal expansion coefficient β, in the row under the six values, comes from the same equations of state: 0.003421 1/K for air at 20 °C and 1 atm, close to the ideal-gas 1/T = 0.003411 1/K, and 2.068 × 10⁻⁴ 1/K for water. No formulation publishes a check value for β itself, but it is built from the same derivatives as cp, which are checked.
You can enter air from −60 to 1000 °C and 1 kPa to 10 MPa, with humidity from 0 to 100 °C, and liquid water from 0 to 350 °C and 1 kPa to 100 MPa as long as it does not boil. Above the boiling point at your pressure, plus 0.05 K, you get no values but the pressure that keeps the water liquid, rounded up. Steam is not covered.
If you want to check the numbers, start from the published check values: the equations behind the tool reproduce the test tables of IAPWS-95, IAPWS-IF97, IAPWS 2008 and IAPWS 2011, table V of Lemmon and Jacobsen, and 915 rows of the air tables in Lemmon et al. CIPM-2007 has no worked example, so there we checked every number the paper derives from its own equations. Every property value the tool gives is computed with the formulation cited next to it. Every comparison on this page, between two values or two models and given as a percentage, ratio or factor, is our own calculation from those values. The uncertainties are the authors’ own, as cited.
For water we use IAPWS-95 rather than the lighter industrial formulation IAPWS-IF97 for the density and specific heat. Over the liquid range of the tool the two agree within 0.0033 % in density, but IF97’s cp differs by up to 0.12 %, enough to change the fourth figure (4.183 against 4.185 kJ/(kg·K) at 60 °C and 1 atm), and it moves the cp minimum from about 36 to about 41 °C.
Our Reynolds number calculator and pipe pressure drop calculator compute the viscosity of air with Sutherland’s law. At 20 °C and 1 atm it gives 1.813 × 10⁻⁵ Pa·s, 0.40 % below the 1.821 × 10⁻⁵ Pa·s here and inside the 1 % that Lemmon and Jacobsen give for the dilute gas [5]. The gap grows with temperature, to 1.8 % at 300 °C and 5.5 % at 1000 °C, so for hot air take μ from here. For water both use IAPWS-IF97 with the IAPWS 2008 viscosity and agree with this page within 0.002 % from 10 to 60 °C. The y+ calculator starts from fixed values at 20 °C instead: 1.813 × 10⁻⁵ Pa·s for air, and 998.2 kg/m³ and 1.002 × 10⁻³ Pa·s for water, 0.04 % above the viscosity here. The links under the result send this page’s values to the y+, Reynolds number and Nusselt number calculators.
Using air and water properties in a CFD model
A new Simcenter STAR-CCM+ simulation gives air a constant density of 1.18415 kg/m³, a viscosity of 1.855 × 10⁻⁵ Pa·s, cp = 1003.62 J/(kg·K) and k = 0.02603 W/(m·K) [14]. That density matches dry air at about 25 °C and 1 atm, so a model of air at 60 °C that keeps it carries a density about 12 % too high.
The properties do not all change at the same rate. Between 20 and 50 °C the viscosity of water falls by 45 %, from 1.0016 to 0.5465 mPa·s, while its specific heat changes by 0.06 %. The ribbon in the tool shows this over your own range, and the line under it gives each change as a factor over the range it covers: the property that changes least there is the one you can most safely keep constant. For humid air that range stops where more than a tenth of the gas is water vapour, because above it the μ, ν, cp, k and Pr shown are not valid.
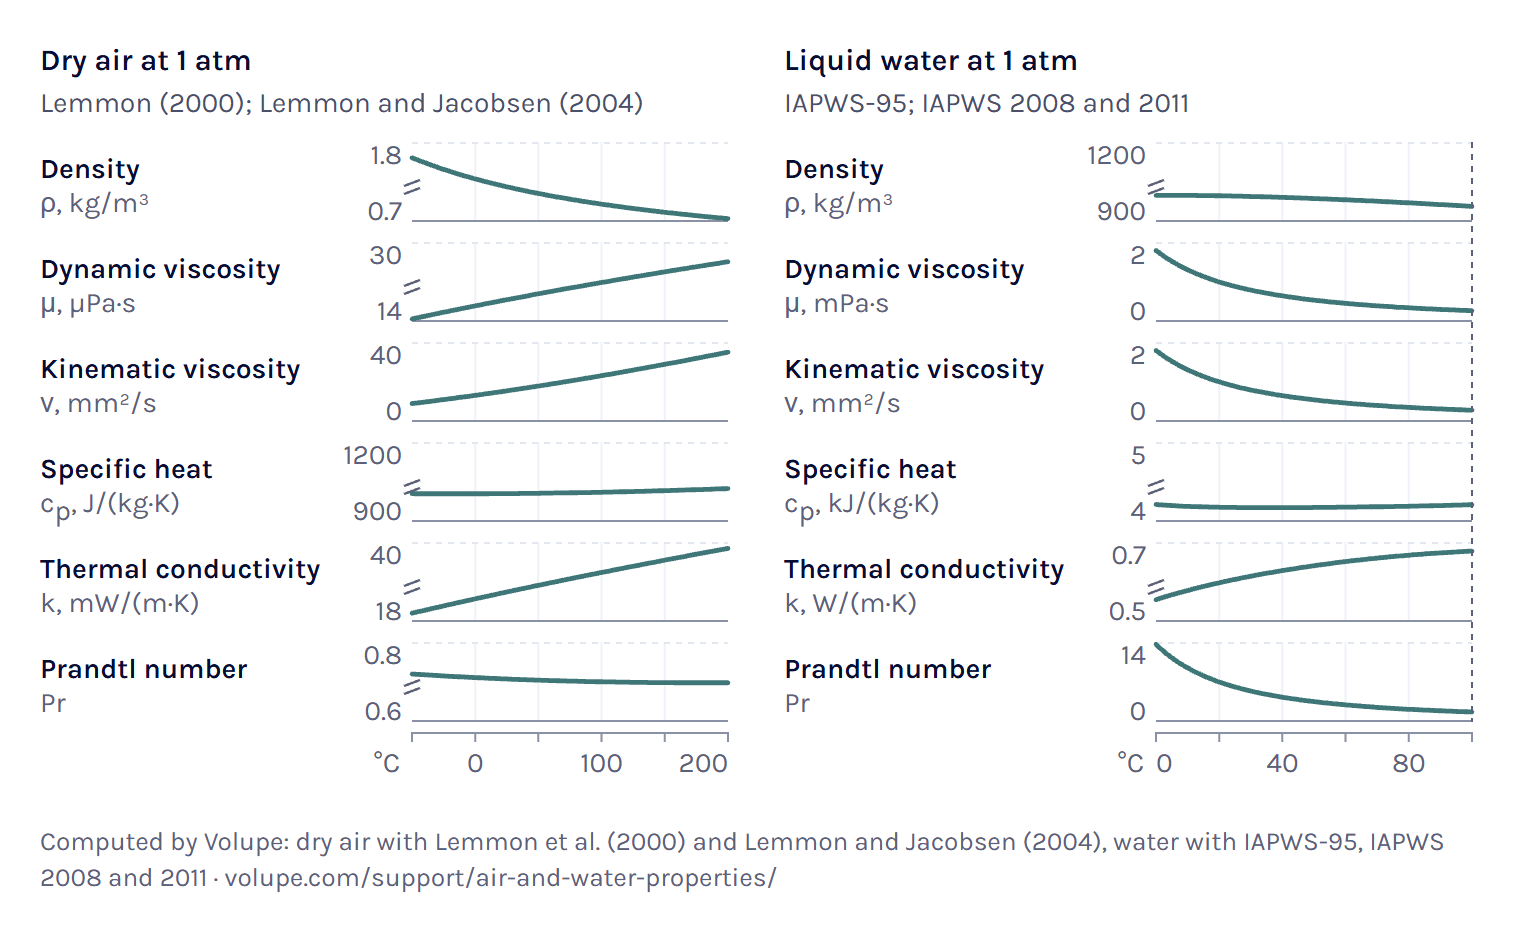
You can keep viscosity, specific heat and conductivity constant at a representative temperature. The natural-convection tutorial in the Simcenter STAR-CCM+ documentation does that: it keeps them constant at a bulk temperature of 300 K and lets only the density follow the ideal gas law [14]. For a heat transfer correlation, our Nusselt number calculator shows the film temperature to take them at, or the mean temperature in a tube or duct. If a property changes more than you can accept over the temperature range of your model, viscosity and conductivity can also be a polynomial or a table in temperature, or Sutherland’s law for a gas, and anything temperature-dependent needs the energy model [14].
For buoyancy-driven flow there are two routes. The Ideal Gas model computes ρ = p/(RT), and with it the reference pressure becomes part of the density, so set it to the real operating pressure. Set to incompressible, the density follows the temperature and the reference pressure but not the local pressure [14, 15]. Johan Bernander’s post on hydrostatic pressure in Simcenter STAR-CCM+ calls a purely temperature-dependent density the recommended practice for buoyancy-driven flows.
A constant density gives no buoyancy at all unless you add the Boussinesq model. That model keeps one density in every equation and lets only the buoyancy force follow the temperature. It needs the Constant Density model and the fluid’s thermal expansion coefficient β, and it holds while β·ΔT is much smaller than one [14].
You get β in the row under the six values. For air it is close to 1/T, so a temperature difference of 30 K already gives β·ΔT ≈ 0.1. For water it is 2.068 × 10⁻⁴ 1/K at 20 °C, and it passes through zero at 3.98 °C, where the density has its maximum, so a single constant β cannot describe water around 4 °C.
With gravity on and a variable density, the reference density defaults to 1.0 kg/m³, not the fluid’s density, so set it yourself [15]. Johan’s post goes through what the reference density does to the pressure you read at an outlet.
For liquid water, the IAPWS-IF97 (Water) model takes the density and specific heat from IAPWS-IF97, valid from 0 to 350 °C and up to 100 MPa [14]. That formulation differs from the IAPWS-95 values here only by the small amounts given under How the values are calculated. Viscosity and conductivity do not follow it until you set their method to IAPWS-IF97 as well, and that method cites the IAPWS 2008 and 2011 formulations, the same releases this page uses [14]. If you run the energy solver on GPUs, every material property must be a constant, a polynomial, a power law, Sutherland’s law or a table, so IAPWS-IF97 for water is not supported there [14].
A table works there. The CSV download under the result is laid out as a file table for a Table(T) property, in the format the Simcenter STAR-CCM+ documentation describes, with quoted headings and the units in parentheses. Ours gives the temperature in K and one column per property. For the property you pick the temperature column and the column you need. Between the rows the value is interpolated linearly by default, and outside the table it stays at the nearest row, so export the whole temperature range of your model [14].
In a conjugate heat transfer model the same three properties, ρ, cp and k, also set how fast heat diffuses, through the time scale ρcpL²/k. Johan Bernander’s post on time-step selection in a conjugate heat transfer analysis compares that time scale for the solid with the time scale of the flow. Our page on material properties for FEA gives the solid’s ρ, cp and k at 20 °C for carbon and stainless steels, 6082-T6 aluminium and copper.
With the links under the result you take the values to our other calculators: ρ and μ to the y+ calculator and the Reynolds number calculator, and ρ, μ, cp, k and β to the Nusselt number calculator. For water near and below its density maximum (about 4 °C at 1 atm), where β is about zero or negative, the Nusselt link carries no β.
References and changelog
References
[1] E. W. Lemmon, R. T Jacobsen, S. G. Penoncello and D. G. Friend, Thermodynamic properties of air and mixtures of nitrogen, argon, and oxygen from 60 to 2000 K at pressures to 2000 MPa, Journal of Physical and Chemical Reference Data 29(3), 331–385, 2000. doi.org
[2] A. Picard, R. S. Davis, M. Gläser and K. Fujii, Revised formula for the density of moist air (CIPM-2007), Metrologia 45, 149–155, 2008. doi.org
[3] IAPWS R6-95(2018), Revised Release on the IAPWS Formulation 1995 for the Thermodynamic Properties of Ordinary Water Substance for General and Scientific Use, International Association for the Properties of Water and Steam, 2018. iapws.org
[4] IAPWS R7-97(2012), Revised Release on the IAPWS Industrial Formulation 1997 for the Thermodynamic Properties of Water and Steam, 2012. iapws.org
[5] E. W. Lemmon and R. T Jacobsen, Viscosity and thermal conductivity equations for nitrogen, oxygen, argon, and air, International Journal of Thermophysics 25(1), 21–69, 2004. doi.org
[6] J. M. Cimbala, Vapor pressure and viscosity, ME 320 lesson 01E, Penn State University, 2022. www.me.psu.edu
[7] IAPWS R12-08, Release on the IAPWS Formulation 2008 for the Viscosity of Ordinary Water Substance, 2008. iapws.org
[8] P. Flowers, K. Theopold, R. Langley and W. R. Robinson, Chemistry 2e, OpenStax, Rice University, 2019, section 10.2, Properties of liquids. openstax.org
[9] NASA Glenn Research Center, Viscosity, Beginner’s Guide to Aeronautics, read 5 November 2026. www.grc.nasa.gov
[10] W. Moebs, S. J. Ling and J. Sanny, University Physics Volume 1, OpenStax, Rice University, 2016, section 14.7, Viscosity and turbulence. openstax.org
[11] A. Thompson and B. N. Taylor, Guide for the Use of the International System of Units (SI), NIST Special Publication 811, 2008 edition, appendix B. nvlpubs.nist.gov
[12] IAPWS R15-11, Release on the IAPWS Formulation 2011 for the Thermal Conductivity of Ordinary Water Substance, 2011. iapws.org
[13] Y. A. Çengel and J. M. Cimbala, Fluid Mechanics: Fundamentals and Applications, McGraw-Hill, table A-9, Properties of air at 1 atm pressure, page 948 of the edition reproduced in J. M. Cimbala’s course material at Penn State University (linked). www.me.psu.edu
[14] Simcenter STAR-CCM+ documentation, version 2606, Siemens Digital Industries Software, 2026: material properties and their methods, equations of state, the Boussinesq model, file tables, GPU solver support and the natural-convection tutorial.
[15] Siemens Knowledge Base, Simcenter STAR-CCM+ articles on reference values (KB000040530, 2022) and on the reference density in a multiphase model (KB000065492, 2022).
Changelog
November 2026: first published, with the calculator, the property tables (their data also as CSV files) and this guide. The equations were tested against the published check values of each formulation, each cited statement against the saved text of its source, and the Simcenter STAR-CCM+ statements against the Siemens documentation. Property values come from the formulations cited next to them, and the comparisons between values and between models are our own calculation.
Questions about air and water properties
Questions about material properties, buoyancy or heat transfer in your model? We reply within one day.
Ask a technical question →
What is the density of air at room temperature?
At 20 °C and 1 atm, dry air has a density of 1.204 kg/m³ (0.07518 lb/ft³), and at 25 °C 1.184 kg/m³ (0.07392 lb/ft³). Humid air is slightly lighter: at 20 °C and 50 % relative humidity the CIPM-2007 formula makes it 0.44 % lighter.
Is cold or warm air denser?
Cold air. At a given pressure the density of a gas falls as its absolute temperature rises: dry air at 1 atm has 1.293 kg/m³ at 0 °C and 1.127 kg/m³ at 40 °C, so each cubic metre of the cold air holds about 15 % more mass.
At what temperature is water densest?
At 3.98 °C, where the IAPWS-95 density of liquid water at 1 atm has its maximum, 999.97 kg/m³ (62.426 lb/ft³). It is lighter both below and above that temperature, with 999.84 kg/m³ at 0 °C and 998.21 kg/m³ at 20 °C.
What is the viscosity of water at 20, 25 and 30 °C?
At 1 atm the dynamic viscosity of water is 1.0016 mPa·s (cP) at 20 °C, 0.9544 at 22 °C, 0.8900 at 25 °C and 0.7972 at 30 °C. In Pa·s, which is kg/(m·s), the values at 20, 25 and 30 °C are 0.0010016, 8.900 × 10⁻⁴ and 7.972 × 10⁻⁴.
What is the difference between dynamic and kinematic viscosity?
Dynamic viscosity μ links the shear stress in a fluid to the velocity gradient, τ = μ du/dy, in Pa·s or mPa·s (cP), and kinematic viscosity ν = μ/ρ is the dynamic viscosity divided by the density, in m²/s or mm²/s (cSt). For water at 20 °C, μ = 1.0016 mPa·s and ν = 1.0034 mm²/s.
Why does the viscosity of air rise with temperature while the viscosity of water falls?
In air at 1 atm, a dilute gas, kinetic theory gives a viscosity proportional to √T divided by a collision integral that gets smaller as the gas warms, so the viscosity rises. In water the molecules are held together by the forces between them, and warmer, faster molecules are better able to overcome those forces, so the viscosity falls.
Does humidity change the density of air?
Yes, a little: humid air is lighter than dry air at the same temperature and pressure. At 20 °C and 1 atm, 50 % relative humidity lowers the density from 1.204 to 1.199 kg/m³, by 0.44 % according to the CIPM-2007 formula, and saturated air is 0.87 % lighter.