Vortex shedding simulator: Kármán vortex street live
A 2D virtual wind tunnel with four shapes: watch vortex shedding and measure the Strouhal number live.
Virtual wind tunnel simulator
Live 2D lattice Boltzmann solution
The graphics card was reset. The flow resumes as soon as the browser restores it.
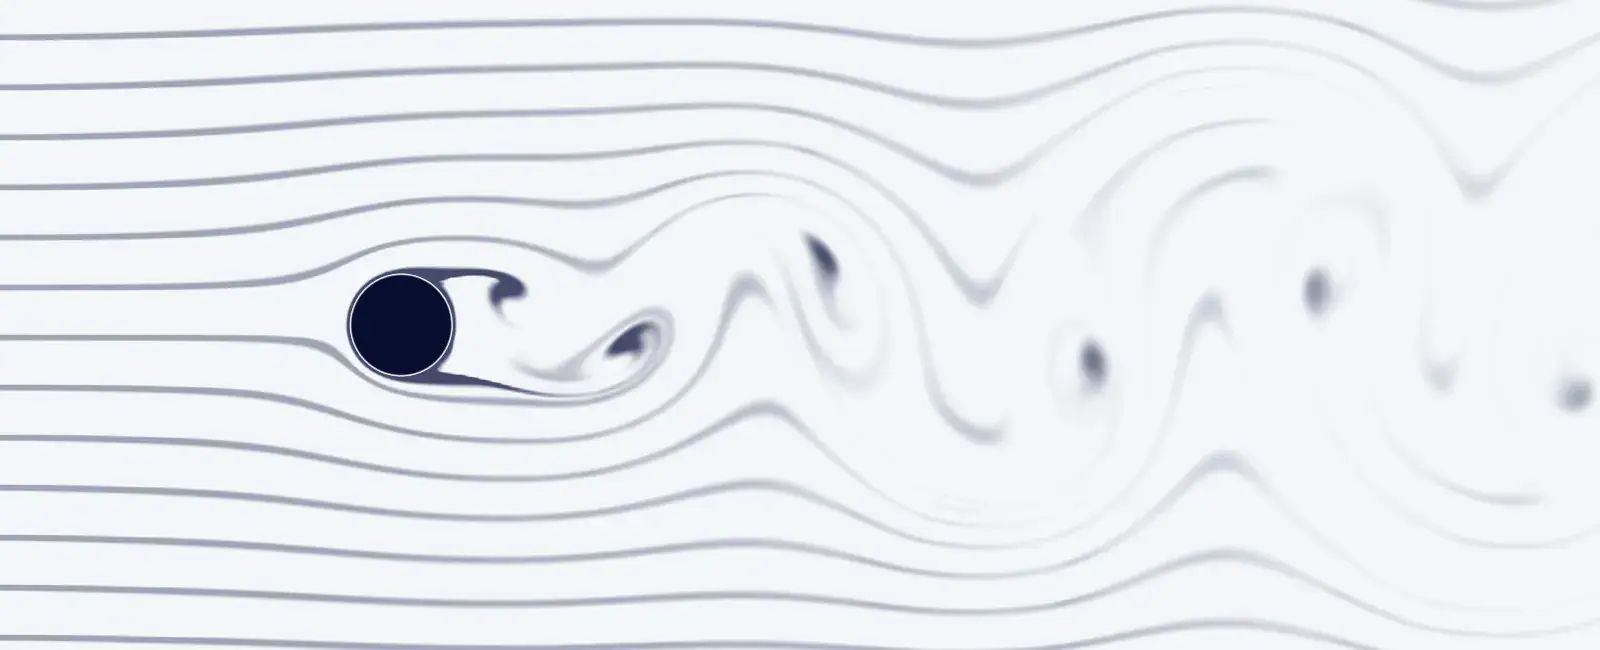
This flow lab needs WebGL 2 with floating-point render targets, which this browser or device does not offer. The picture shows what it computes.
Drag the body to stir the flow, or select the flow and use the arrow keys. Space pauses.
Each one sets up a case and says what to look for.
Strouhal number
St = fD/U: how often vortices leave, scaled by size and speed.
–
Drag and lift
Forces on the body, made dimensionless with ½ρU²D.
–
Aeolian tone
The note a thin wire sings in the wind, at the measured St.
–
Coarse lattice for this Reynolds number: the numbers are rough, and they are not added to the chart. Choose more cells across the body under CFD set-up.
| Re | St |
|---|
Is the answer independent of the grid?
Run the same case on three lattices, 16, 24 and 36 cells across the body (each 1.5 times finer), and estimate the discretisation error with the grid convergence index (GCI). It is a standard check of a CFD result. Here it covers the lattice spacing only; the Mach number and the domain stay the same. It takes from a few seconds on a fast graphics card to several minutes on a phone.
| Cells across D | Strouhal number | Mean Cd |
|---|---|---|
| 16 | – | – |
| 24 | – | – |
| 36 | – | – |
How this is computed
- D2Q9 lattice Boltzmann method with a two-relaxation-time collision, solved on your graphics card (WebGL 2). The body wall uses interpolated bounce-back (Bouzidi, Firdaouss and Lallemand 2001), which puts the wall at its exact distance along each lattice link, so the outline is not reduced to stair steps. Uniform inflow 8 D upstream; free-slip channel walls; damping zones after the inlet and before the outlet.
- Shapes: circular cylinder (diameter D), square (side D), flat plate (width D, thickness 0.12 D) and a NACA 0012 airfoil (chord 2 D, turning about its quarter chord, trailing edge kept at least 1.2 lattice cells thick). Re, St, Cd and Cl use D, or the chord for the airfoil. The reference curve and the markers on the slider belong to the circular cylinder only.
- Channel walls block part of the flow; the blockage shown is the height the body presents to the flow divided by the channel height. In this lab, narrower channels give a higher shedding frequency.
- Lattice inflow speed 0.1 (Mach number about 0.17), and 0.05 in the 20 D channel, whose transverse sound wave would otherwise fall in the shedding range. The Reynolds number is set through the viscosity.
- Lift and drag by momentum exchange on the body; the Strouhal number from upward crossings of the lift about its mean.
- Grid study: three lattices with a refinement ratio of 1.5; observed order, extrapolated value and GCI with a safety factor of 1.25 (Celik et al. 2008). When the three values go up and down, the convergence is oscillatory and is reported as such.
- Streamlines are contours of the stream function, seen from the body or from a frame moving with the free stream. Particles: about 1400 tracers (900 on a phone) moved with the local velocity.
- References: Roshko (1954), NACA Report 1191, St = 0.212 (1 − 21.2/Re) for 50 < Re < 150, a fit to measurements; shedding starts at about Re 40 to 50; the wake becomes unstable to three-dimensional disturbances at Re = 188.5 (Barkley & Henderson 1996).
- Tone: f = St·U/D for a 1 mm wire in air at 20 °C (ν ≈ 1.51 × 10⁻⁵ m²/s). The pitch follows the measured St; the loudness is not real.
What is vortex shedding?
Vortex shedding is the periodic release of vortices from the two sides of a bluff body in turn. In the flow past a circular cylinder it starts at a Reynolds number of about 40 to 50 [1]. Below that, the flow separates from the back of the cylinder from about Re 6 but stays steady, with two fixed eddies in the wake [2]. Above it, the eddies break away one at a time, and the wake settles into two staggered rows of vortices of opposite sign: the Kármán vortex street [1].
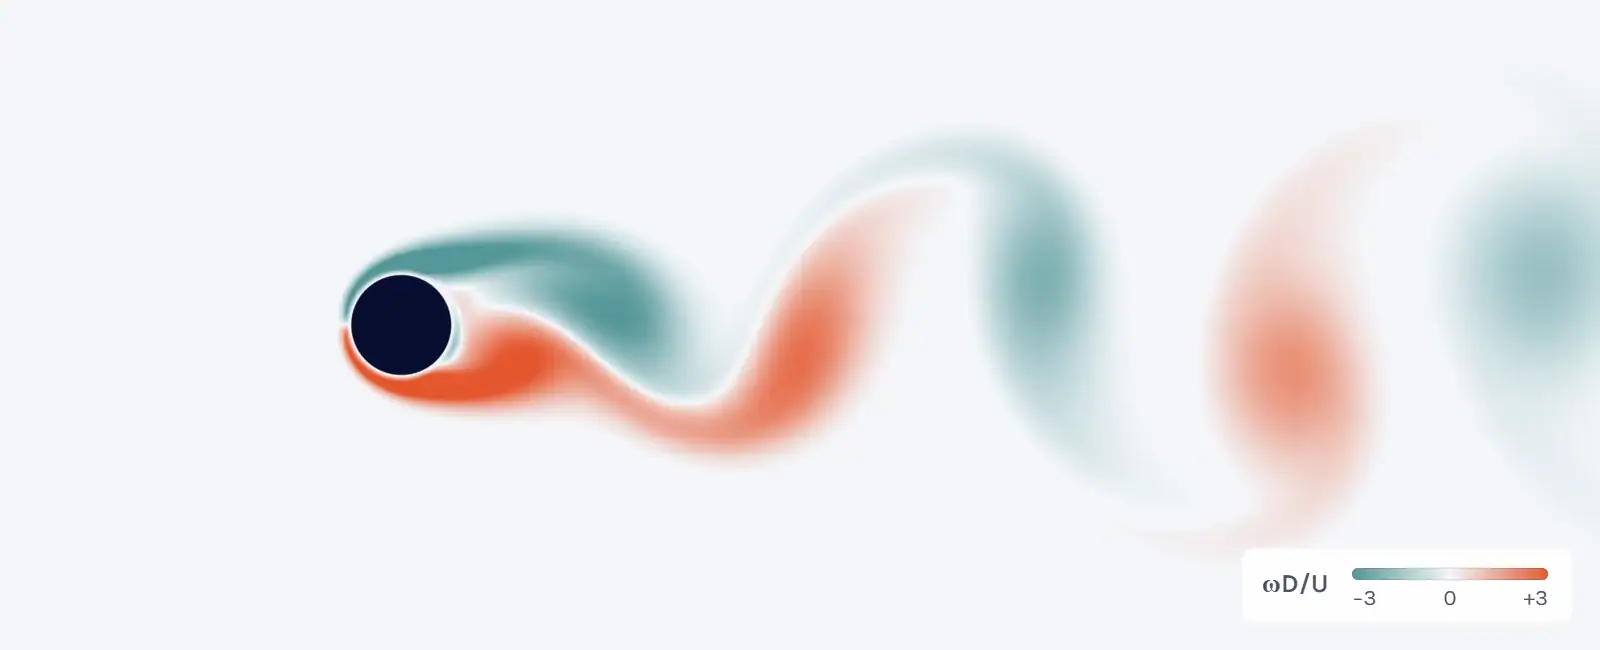
Each vortex that leaves changes the pressure on its side of the body, so the lift swings at the shedding frequency. The drag swings at twice that frequency, once for each vortex. The monitor plot under the simulator shows both.
The swinging side force is what engineers care about, since it can make a slender structure vibrate when the shedding frequency comes close to one of its natural frequencies.
The street is named after Theodore von Kármán (often written von Karman), who gave a theory of it in 1911. Ahlborn published the first modern pictures of the alternating vortices in 1902, and Bénard pointed out the importance of the phenomenon in 1908 [1].
How to use the simulator
The lab runs on your graphics card with WebGL 2. On a phone it uses a lighter lattice.
Strouhal number: definition, formula and values for a cylinder
The Strouhal number is the shedding frequency made dimensionless with the size of the body and the flow speed:
St = f D / U (1)
Here f is the shedding frequency (Hz), D the diameter of the cylinder, or another stated width of the body, and U the free-stream speed (m/s). For a circular cylinder St depends on the Reynolds number. Roshko measured it and fitted St = 0.212 (1 − 21.2/Re) for 50 < Re < 150 [1]:
From Re 150 to 300 the wake goes through a transition, and no single value applies [1]. For 300 < Re < 2000 Roshko’s second fit is St = 0.212 (1 − 12.7/Re), which gives 0.209 at Re 1000, and in the irregular range he studied, up to Re 10 000, St is essentially constant [1]. Check the Reynolds number before you use a value.
To find St from a measurement or a simulation, take the frequency of the lift, or of the velocity at a point in the wake, and use equation (1). The simulator times the upward crossings of the lift through its mean. Once three periods in a row agree within 1 %, it takes St as the mean of all periods from there, and shows it as final after six more periods.
Vortex shedding frequency: f = St·U/D
Turn equation (1) around and you get the shedding frequency:
f = St · U / D (2)
Take a 1 mm wire in air at 20 °C, where ν ≈ 1.51 × 10⁻⁵ m²/s. At 1.51 m/s its Reynolds number is UD/ν = 100. Roshko’s fit gives St = 0.167 at Re 100 [1], so f = 0.167 × 1.51 / 0.001 ≈ 252 Hz. This is the aeolian tone, the note a thin wire sings in the wind. The tone card of the simulator does the same sum with the St it has measured.
A 10 mm cylinder in the same air at 5 m/s has Re ≈ 3300. That is in Roshko’s irregular range, where St is essentially constant [1]. With St ≈ 0.21, the value the Reynolds number calculator uses there, f ≈ 0.21 × 5 / 0.01 ≈ 105 Hz. The wake is irregular at that Reynolds number, so this 2D simulator cannot show it, but the estimate of the frequency still holds. A transient CFD run of such a flow also needs enough time steps per period, and the Courant number calculator works through a vortex shedding case.
From about Re 40 to 190: what changes
The wake of a circular cylinder goes through a series of regimes as the Reynolds number rises:
The simulator is two-dimensional, so it describes the real flow up to about Re 190. The slider goes on to Re 250 inside a hatched band, where the 2D solution still sheds but a real cylinder wake has turned three-dimensional.
Where shedding starts also depends on the set-up. In the simulator’s 10 D channel, with 20 cells across the cylinder, it starts close to Re 46. Started from a steady wake at Re 47, the swing grows into a regular street within one to two minutes, while at Re 46 it grows so slowly that the lab gives no verdict for minutes. Near the onset everything happens slowly, so give it a minute or two.
Other shapes in the virtual wind tunnel: square, plate and airfoil
The square has side D and turns from 0° to 45°. The flat plate has width D and thickness 0.12 D and turns from 0°, along the flow, to 90°, across it. Turned across the flow, both shed a vortex street, and you can compare their Strouhal number with the cylinder’s at the same Reynolds number. For both, the lab’s Re, St, Cd and Cl use D at every angle. Their wakes turn three-dimensional at Reynolds numbers of their own, which the lab does not mark. The lab has no reference curve for them, and their numbers change by up to about 10 % with the lattice, so run the grid study before you quote one.
The NACA 0012 airfoil has a chord of 2 D and turns about its quarter chord. Its Reynolds number is based on the chord and goes up to 500, far below that of a real wing in flight, so the boundary layers stay laminar. In the lab the wake is steady at small angles of attack. At 18° and Re 400, the “Airfoil at 18°” set-up, the flow leaves the upper surface and the wake sheds vortices, while at Re 100 it stays steady even at 18°. The lift and drag the lab shows for the airfoil are therefore not data for a wing in flight. For drag coefficients of real bodies, use the drag coefficient calculator.
The reference curve, the onset band and the validation below are for the circular cylinder only.
How the simulation works: the lattice Boltzmann method
The simulator solves the flow with the lattice Boltzmann method, on your graphics card. Instead of velocity and pressure it stores, for every cell of a square lattice, how much fluid moves in each of nine directions, one of them at rest (the D2Q9 lattice). In every time step these populations collide and then stream to the neighbouring cells, and the density and velocity follow from them. With a suitably chosen equilibrium, a scheme of this kind gives the Navier–Stokes equations [6].
The channel is 25 D long and 5, 10 or 20 D high, with uniform inflow 8 D ahead of the body, walls the fluid can slide along (free slip), and damping zones after the inlet and before the outlet. The collision uses two relaxation times. The wall of the body is placed at its exact distance along each lattice link, with interpolated bounce-back after Bouzidi, Firdaouss and Lallemand [5], so a circle is not reduced to stair steps.
The lattice inflow speed is 0.1, a Mach number of about 0.17, and 0.05 in the 20 D channel. The Reynolds number is set through the viscosity. Lift and drag come from the momentum the fluid exchanges with the body. With 20 cells across the cylinder, the 10 D channel is a lattice of 500 × 200 cells.
Note that the lab is two-dimensional and laminar, with no turbulence model, and that its lattice fluid is slightly compressible, which is why the inflow speed is kept low. For the cylinder it shows laminar shedding well up to about Re 190. For three-dimensional and turbulent flows you need full CFD, and the turbulence model selector suggests a model to start from.
Validation against published data
The reference is Roshko’s fit [1], 0.167 at Re 100. The table gives the lab’s own results for the cylinder at Re 100 with 20 cells across it, in the three channel heights:
In this lab the channel walls raise the shedding frequency, and the narrower the channel, the larger the difference. Roshko measured real cylinders in a wind tunnel and corrected for the tunnel blockage, but not for end effects [1], so a two-dimensional solution is not expected to match his fit exactly. In the 20 D channel most of what is left goes with a longer inflow. In a test run of the lab’s code with the inlet 16 D ahead of the cylinder instead of 8 D, which is not a setting in the lab, St came out at 0.168, 0.5 % above Roshko’s fit.
A grid study at Re 100 in the 10 D channel gives St 0.1766, 0.1766 and 0.1767 on 16, 24 and 36 cells across the cylinder, and Cd 1.479, 1.477 and 1.475, so the difference does not come from the lattice. The three values are too close for a grid convergence index, since they differ by less than 0.1 % in St and 0.3 % in the drag. The drag also agrees within 0.03 % with a momentum balance over a control volume around the body.
You can run the grid study yourself under the simulator. It uses the grid convergence index of Celik et al. [4], with a refinement ratio of 1.5 and a safety factor of 1.25, and says so when the three values are too close or go up and down.
References and changelog
References
[1] A. Roshko, On the development of turbulent wakes from vortex streets, NACA Report 1191, 1954. https://ntrs.nasa.gov/citations/19930092207
[2] S. Sen, S. Mittal and G. Biswas, Steady separated flow past a circular cylinder at low Reynolds numbers, Journal of Fluid Mechanics 620, 89–119, 2009. https://doi.org/10.1017/S0022112008004904
[3] D. Barkley and R. D. Henderson, Three-dimensional Floquet stability analysis of the wake of a circular cylinder, Journal of Fluid Mechanics 322, 215–241, 1996. https://doi.org/10.1017/S0022112096002777
[4] I. B. Celik, U. Ghia, P. J. Roache, C. J. Freitas, H. Coleman and P. E. Raad, Procedure for estimation and reporting of uncertainty due to discretization in CFD applications, Journal of Fluids Engineering 130(7), 078001, 2008. https://doi.org/10.1115/1.2960953
[5] M. Bouzidi, M. Firdaouss and P. Lallemand, Momentum transfer of a Boltzmann-lattice fluid with boundaries, Physics of Fluids 13(11), 3452–3459, 2001. https://doi.org/10.1063/1.1399290
[6] Y. H. Qian, D. d’Humières and P. Lallemand, Lattice BGK models for Navier-Stokes equation, Europhysics Letters 17(6), 479–484, 1992. https://doi.org/10.1209/0295-5075/17/6/001
Changelog
November 2026: first published, with the simulator, the Strouhal number table and this guide.
Reviewed by Christoffer Johansson, M.Sc., Senior Application Specialist at Volupe, in November 2026.
Questions about vortex shedding

Page reviewed by
Christoffer Johansson
Senior Application Specialist, M.Sc.
Email Christoffer · LinkedIn
Questions about vortex shedding, Strouhal numbers or your own flow case? We reply within one day.
Ask a technical question →
What is vortex shedding?
Vortex shedding is the periodic release of vortices from the two sides of a bluff body in turn. Behind a circular cylinder it starts at a Reynolds number of about 40 to 50 and forms a Kármán vortex street: two staggered rows of vortices of opposite sign. Each vortex that leaves makes the lift swing, so the body feels a side force at the shedding frequency.
What is the equation for vortex shedding frequency?
The vortex shedding frequency is f = St·U/D, where f is the shedding frequency in Hz, St the Strouhal number, U the flow speed and D the diameter. St depends on the Reynolds number and on the shape. For a circular cylinder at Re 100, Roshko’s fit gives St = 0.167, so a 1 mm wire in air at 20 °C and 1.51 m/s sheds at about 252 Hz.
How do you find the Strouhal number?
Measure the shedding frequency f, for example from the lift or from the velocity at a point in the wake, and compute St = fD/U. For a circular cylinder at 50 < Re < 150 you can also use Roshko’s fit to his measurements, St = 0.212 (1 − 21.2/Re). The simulator measures St from the lift and compares it with that fit.
What is the Kármán vortex street?
A Kármán vortex street is the double row of staggered vortices of opposite sign behind a body that sheds vortices. It is named after Theodore von Kármán, who gave a theory of it in 1911; Ahlborn published the first modern pictures in 1902, and Bénard pointed out its importance in 1908. Behind a cylinder it is laminar and regular from about Re 40 to 150.
At what Reynolds number does vortex shedding start?
Behind a circular cylinder, vortex shedding starts at a Reynolds number of about 40 to 50. Below that, the flow separates from the back of the cylinder from about Re 6 but stays steady, with two fixed eddies in the wake. In this simulator’s 10 D channel, with 20 cells across the cylinder, it starts close to Re 46. Started from a steady wake, at Re 47 the swing grows into a regular street within one to two minutes, while at Re 46 it barely grows.
Is this a wind tunnel simulator? Which shapes can I test?
It is a 2D virtual wind tunnel for laminar flow, with a circular cylinder, a square, a flat plate and a NACA 0012 airfoil, at Reynolds numbers up to 250, or 500 for the airfoil based on its chord. The reference curve and the validation are for the cylinder only, and at these low Reynolds numbers the airfoil’s lift and drag are not data for a wing in flight.
Why is the cylinder simulation only valid up to Re ≈ 190?
Because the real cylinder wake turns three-dimensional. At Re 188.5 the two-dimensional wake becomes unstable to three-dimensional disturbances, as Barkley and Henderson (1996) showed. The simulator is two-dimensional, so above that it still shows a 2D street, while the real flow no longer looks like it. The square and the plate turn three-dimensional at Reynolds numbers of their own, and the lab gives no limit for them.